Mitosis, Meiosis, and Genetics
Background
Dr. Fankhauser on the wall of Mendels greenhouse
In his studies on inheritance in peas, Gregor Mendel showed
that an offspring formed by the fertilization of an egg by a sperm gets half
its alleles from each parent. Exactly which alleles for each trait the
offspring receives from the parents follows the laws of probability. This
can be illustrated by coin tosses. If a single coin is tossed, it will land
heads or tails with a 50:50 chance of each. If two coins are tossed, each
has a 50:50 chance of being heads or tails. Thus, the probability of
obtaining, for example, two heads should be ½ × ½ = ¼.
The genotype
of an organism is its actual genetic make-up; which two alleles for a trait
(gene) it actually has. Its phenotype (pheno = show, seem,
appear) is how those genes are expressed; what it looks like. For example,
a person with one allele for brown eyes and one for blue will have the
genotype Bb, but that persons phenotype will be brown eyes because brown is
dominant over blue (like getting one head plus one tail when two coins are
tossed together).
The processes of mitosis and meiosis were discovered in the
1870s and 1890s, respectively. It was later concluded that the movement of
the chromosomes in meiosis was responsible for the behavior of the alleles
during reproduction, as Mendel noted. Mitosis (mito = a thread)
is the process of replication and division of the chromosomes as a cell
divides to make two cells. Meiosis (meio = less) is a special
type of division in which the chromosome number is reduced by half, resulting
in gametes (sex cells: eggs and sperm) with only one chromosome from
each of the pairs that are present in our somatic cells (general body
cells - soma = body).
Materials Needed
Part A Mitosis and Meiosis
- microscope
- slide of onion (Allium cepa)
root tip mitosis (# B-552)
- slide of whitefish (Coregonus
clupeiformis) blastula mitosis (# E-1025)
- slide(s) of Ascaris megalocephala
(a roundworm) uterine section showing meiosis or mitosis in eggs, zygotes,
or embryos (# E-325, E-335, E-354, E-355)
- slides of lily (Lilium sp.)
anthers showing meiosis to form pollen (# B-680, B-682, B-682b, B-683,
B-684, B-685)
- slide of grasshopper testis showing
spermatogenesis (including meiosis) (# G-145)
Part B Probability and Genetics
- mono- and dihybrid cross genetic corn ears
- plain, PTC, thiourea, and sodium
benzoate taste test papers
- coins (total of 4 of 2 kinds)
Procedure
Part A Mitosis and Meiosis
Working individually, obtain and examine under the microscope
each of the slides discussed below. Try to find cells in each of the stages
of mitosis (mito = a thread; -sis = the act of) or meiosis
(meio = less): interphase (inter = between, among), prophase
(pro = before, in front of), metaphase (meta = between, with,
after), anaphase (ana = up, throughout, again), and telophase
(telo = end, complete). Draw what each of these cells you observe
looks like. Label such things as nucleus, nucleoli, nuclear envelope,
chromosomes (chromo = color; soma = body), spindle fibers,
asters (aster = star), etc. if/when present. For further information,
you may also wish to refer to the chapters on mitosis and meiosis in your
lecture text.
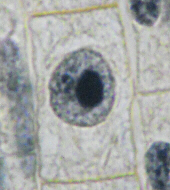
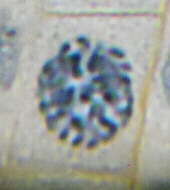
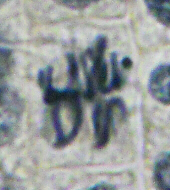
A set of photos from a prepared slide of onion (Allium cepa) root tip
| Interphase | Prophase | Metaphase |
|---|
 |
 |
 |
| Anaphase | Telophase | |
|---|
 |
 | |
- Plant Mitosis: An onion root
tip is a rapidly-growing (meristematic) portion of the onion, thus
many cells in various stages of mitosis may be seen. In interphase, note
that the chromosomes are long and entangled and are not individually visible,
thus the nucleus of such a cell would be fairly-evenly colored and may also
contain one or more nucleoli. During prophase, the chromosomes contract and
become distinct, thus the nucleus of a cell in prophase frequently has a
grainy appearance. By metaphase, the chromosomes are contracted, distinct,
and lined up on the metaphase plate. Try to find and draw a cell that
clearly shows chromosomes with sister chromatids and centromere (this
doubled structure should be visible by late prophase or metaphase). Try to
find a cell in which the chromosomes are fairly well spaced and count them.
What is the diploid chromosome number of onion? Are there asters present in
any stage(s)? In anaphase, note the disjunction of the sister chromatids.
In telophase, note the formation of the new cell plate. How many chromosomes
should be included in each of the daughter nuclei?
A set of photos from a prepared slide of whitefish (Coregonus clupeiformis) blastulas
| Interphase | Prophase |
|---|
 |
 |
| Metaphase | Anaphase |
|---|
 |
 |
| Telophase | |
|---|
 | |
- Animal Mitosis: In whitefish,
as in humans, the blastula (blasto = bud, sprout; -ula
= little) is the hollow ball stage in embryonic development, and thus is
characterized by rapid growth. In prophase, note the chromatin within the
nucleus (the nuclear envelope is intact in early prophase, although not
visible). Are there any asters at this stage? In metaphase, note that the
chromosomes are lined up alone the equator of the cell. Asters are readily
visible and polar fibers are attached to the centromeres of each chromosome.
In anaphase, note the disjunction of the chromosomes. In telophase, note the
constriction type of cytokinesis.
- Plant Meiosis: A lily plant
is 2n, like humans. However, plants do things a bit differently than we do.
The 2n plant generation is called the sporophyte because it produces
haploid spores (via meiosis). Then, those spores grow (via mitosis)
into a totally different 1n plant generation called the gametophyte
(the plant generation which produces gametes). Male gametophytes make sperm
and female gametophytes make eggs. In gymnosperms and angiosperms, the
male gametophytes are called pollen. Notice, pollen and sperm
are not the same thing! In the angiosperms, meiosis happens in two
different places within their flowers. In the anthers, meiosis results
in microspores which grow into male gametophytes which produce sperm,
and in the ovary, meiosis results in megaspores which grow into
female gametophytes which produce eggs.
We will be examining the process of meiosis as it occurs in the anthers to
produce microspores, then male gametophytes (pollen). Because of the timing
of this process, it cannot all be viewed on one slide. Thus, to understand
this process, you will need to view a series of slides made at different
points during meiosis.
- # B-680: Lily Anther,
general structure These anthers just have the precursor 2n germ
cells in them.
- # B-682: Lily Anther, early
prophase I The chromosomes have paired and have begun meiosis.
- # B-682b: Lily Anther, late
prophase I Chromosome tetrads/bivalents should be visible.
- # B-683: Lily Anther, first
meiotic division The chromosomes separate, resulting in 2 daughter cells
that are 1n.
- # B-684: Lily Anther, second
meiotic division The sister chromatids are separated, resulting in a
total of 4 daughter cells that are 1n.
- # B-685: Lily Anther, pollen
tetrads Because of the way plants reproduce, these would be the
precursors to the microspores which will subsequently germinate
and grow into the male gametophytes, also known as pollen.
Within the pollen, two sperm nuclei will be produced. Again,
pollen and sperm are not the same thing, but rather, pollen is
a plant generation that makes sperm.
- # B-686: Lily Anther, mature
pollen grains These are the mature, multicellular, male gametophytes
(pollen), including two special nuclei referred to as the sperm
nuclei visible in each.
Note that the end result of meiosis is four daughter cells. Remember that
in prophase I and metaphase I of meiosis, the homologous chromosomes are
paired (synapsis) into bivalents or tetrads. How many of these bivalents do
you see? What is the diploid chromosome number of lily?
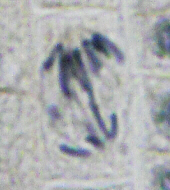
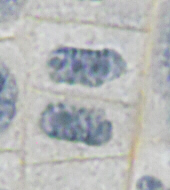
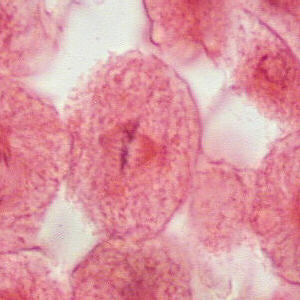
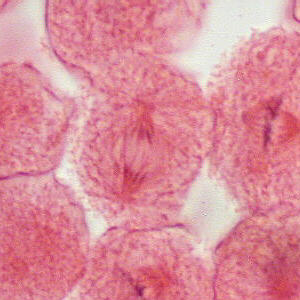
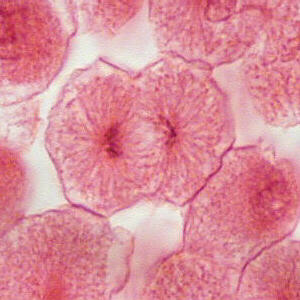
A set of photos from prepared slide of a grasshopper testis
| Various Stages and Structures as Noted |
|---|
 |
| Primary and Secondary Spermatocytes |
|---|
 |
| Spermiogenesis |
|---|
 |
- Animal Meiosis: In male
grasshoppers testes (note: testis is singular, testes is plural),
sperm are formed by meiosis (females ovaries make eggs). The testes
themselves are 2n, while the sperm formed within them are 1n. Each testis is
organized into a series of side-by-side testicular lobes, all of which
open at their proximal (basal, closest) end into the vas deferens. Within
each lobe are a number of testicular cysts, each surrounded by a
septum made of connective tissue. In each cyst are a number of cells
that are undergoing meiosis, and typically, all the cells in a given cyst are
in the same stage of meiosis. Typically, the cysts in the distal (apical,
farthest from the vas deferens) region contain 2n, primary germ cells (cells
which give rise to sperm) called spermatogonia or cells in very early
prophase I. As the cells within the cysts undergo meiosis, the cysts travel
from the distal to the proximal end of the lobe, so that cysts near the
proximal end contain finished, 1n spermatozoa.
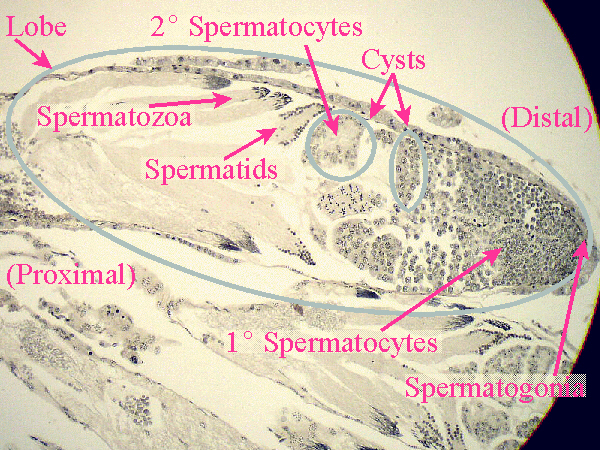
The slide to be examined is a longitudinal section (l.s.) of a grasshopper
testis, and should contain one or more oblong lobes, sliced
lengthwise so a number of cysts and a variety of stages in meiosis
should visible in each lobe. At the rounded, distal end, notice the
2n spermatogonia (goni = seed). These cells undergo the
process of spermatogenesis (genesis = origin, birth), which
includes meiosis and spermiogenesis, the maturation of the 1n
spermatids into motile spermatozoa. As the cells undergo
meiosis I, they are first called primary spermatocytes (cyto =
cell), then during meiosis II, secondary spermatocytes, then (when
meiosis is complete) spermatids. The rounded spermatids are
transformed, via the maturation process called spermiogenesis, into
mature spermatozoa (zoa = animal) as they develop flagella
and become motile.
While many of the primary spermatocytes are in prophase I (in various of the
stages just mentioned), try to find primary spermatocytes in other stages of
meiosis I. In metaphase I, the tetrads move to the center of the cell,
line up there, and are attached by their centromeres to the spindle fibers.
with each of the homologous chromosomes in a pair attaching to a spindle
fiber from the opposite centriole/pole. In anaphase I, the whole
chromosomes (not just the chromatids as in mitosis) are pulled to the poles,
with one homologous chromosome from each pair being pulled to each pole.
This is the reduction division that is characteristic of and central
to the process of meiosis. Meiosis I ends with telophase I, in which
the secondary spermatocytes are formed. The secondary spermatocytes
may be distinguished from the primary spermatocytes by their smaller size.
They undergo meiosis II, a process thats similar to mitosis in that the
sister chromatids are separated (and thus, become chromosomes). The
resulting 1n cells are the spermatids. The spermatids undergo a
maturation process called spermiogenesis which involves changing from
a rounded to a pointed shape and the growth of flagella to enable them to
swim.
Reportedly, 2n = 8 for this organism. Remembering that grasshoppers are an
example of XO inheritance, technically the 2n number should be 7 (because
there is no Y to pair with the X chromosome), and thus, in anaphase I of
spermatogenesis, one daughter nucleus should get 3 autosomes and an X
chromosome while the other should get only the 3 autosomes. (Female
grasshoppers would have two X chromosomes, thus, in oogenesis, all
daughter cells would be expected to receive 4 chromosomes.)
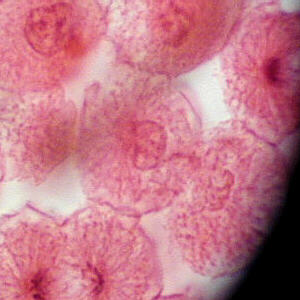
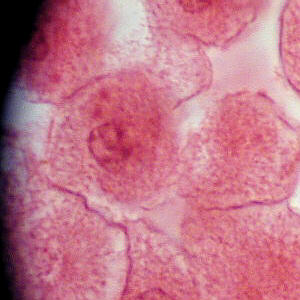
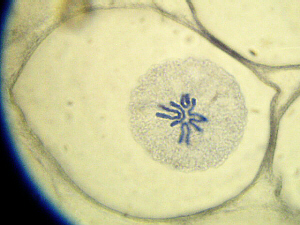
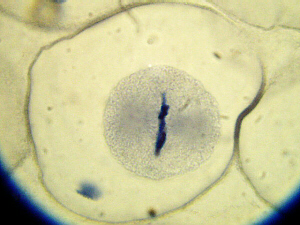
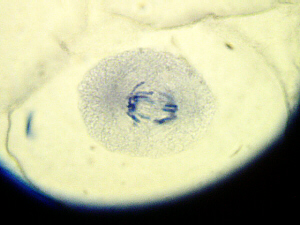
A set of photos from a prepared slide of an Ascaris megalocephala uterus
| Prophase (side) or Metaphase (top)? | Metaphase (note polar body, lower left) |
|---|
 |
 |
| Anaphase | Telophase |
|---|
 |
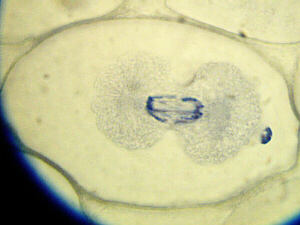 |
- Animal Meiosis/Mitosis:
Ascaris megalocephala is a type of large roundworm that parasitizes
horses. This slide is a cross-section (x.s.) of a female, and at the point
in her body from where these slides were cut, most of whats visible is the
uterus. The process of egg development in Ascaris is similar to
humans: before the egg has completed meiosis, first the sperm nucleus
enters. That triggers completion of meiosis in the egg, including
formation of polar bodies, then the sperm and egg nuclei unite to
form a zygote, then the zygote begins to divide, forming a 2-celled, then a
4-celled, etc., embryo. This whole process is usually not visible all on one
slide, so depending on which slide you are viewing, you will see portions of
this process. Depending on which slide you are viewing, the uterus contains
numbers of either eggs in the process of being fertilized and undergoing
meiosis, or newly-fertilized and rapidly dividing zygotes or very young
embryos. Note that if you are viewing a slide with zygotes/embryos on it,
you may see a mixture of 1-celled zygones and both 2-celled and 4-celled
embryos, in various stages of mitosis. Observe cells in each stage of
mitosis. When are asters present? Find a cell in which the chromosomes are
well spread and try to count them what is the chromosome number of this
organism?
Part B Probability and Genetics
- As a class, examine various human traits which are each thought to be controlled by only
one gene. Note: many of these, previously thought to be one-gene traits, are turning out to be
controlled by several genes. Traits which may be examined include:
- Sex: We all have at least one X chromosome. Usually, a person
with two X chromosomes (genotype XX) is female, and a person with a Y
chromosome (genotype XY) is male. However, it is important to
remember that sex is a phenotype, not a genotype. Sex
is not about how many X or Y chromosomes a person has, but rather,
how the genes on those (and other) chromosomes are actually
expressed.
In humans, sex is a phenotype which is determined by the influence or
lack of influence of the genes located on the Y chromosome, whereas in
fruit flies, sex is determined by the effects of the ratio of the
number of X and Y chromosomes (if an abnormal number). Thus in humans,
XO and XXX would typically also be female while XXY would typically be
male. In humans, a combination such as XXXY would produce a male
phenotype because of the effects of the genes on the Y chromosome, but
in fruit flies would produce a female phenotype because of the
relatively larger number of X chromosomes. However, to complicate
the situation, in humans, there is an X-linked recessive mutation for
androgen insensitivity syndrome (AIS) which causes all cells
in the persons body to be insensitive to the effects of testosterone.
Thus, even if such a person has a Y chromosome, most of its alleles
have no effect and that person is be female. There is more detailed
information on AIS, on the
Genetics Practice Problems
Web page.
- Eye color: We typically talk about
this in terms of B coding for brown eyes, and bb coding for blue eyes.
Again this is an over-simplification. According to the
OMIM Web site,
there are at least two genes which contribute to eye color.
One of these genes has an allele that codes for make brown pigment
and another allele for we dont know how to make brown = default
blue color. The other gene has an allele for make green pigment
and an allele for we dont know how to make green. While, starting
out, it may be easier to understand how genetics works if we only look
at the brown-blue gene, in reality, eye color phenotype is a
combination of the effects of the alleles for both of these
genes.
- PTC-Taster: PTC (phenylthiocarbamide)
is a chemical that tastes bitter to some people while others cannot
taste it at all. Here, too, while we tend to talk about this in terms
of tasters (T) and non-tasters (tt), the reality is a slightly more
complicated situation. This gene, located on chromosome 7, actually
has multiple alleles, one for tasting and at least two different
forms of non-tasting. The penetrance of the gene can vary,
and people who are TT often find the test paper extremely bitter,
while people who are Tt may find it bitter, but not extremely so.
There is also considerable variability (controlled by other genes) in
the threshold concentration needed to trigger a taste reaction, so
some people might not notice a bitter taste at a lower concentration,
but would react negatively to a higher concentration. One researcher
found that a 0.02% solution of PTC was tasteless to 75% of the people
on whom he tested it, but a 0.64% solution was tasted by 85% of his
subjects. Interestingly, PTC must be dissolved in a persons own
saliva to be tasted. If it is dissolved in someone elses saliva or
in plain water, and placed on a dry tongue, the person cannot taste
it.
It is reported that, in the average US population, about 70% of
people are tasters and 30% non-tasters. Thus, this gene is often used
to introduce the concept of population genetics, the rules of
which were developed by two people named Hardy and Weinberg, hence
referred to as the Hardy-Weinberg Law. If p is the probability of
the allele T and q is the probability of the allele t, then the
probability of TT would be p2, the probability of tt
would be q2, and the probability of Tt (= Tt + tT,
remember?) is 2pq. Since everyone in the population has to be either
TT, Tt, or tt, the probabilities of those have to add up to 1 (100%),
so p2 + 2pq + q2 = 1. Recall from algebra that
p2 + 2pq + q2 = (p + q)2. Thus, if
(p + q)2 = 1 and we take the square root of both sides, that
means p + q = 1, too. If 30% (0.30) of the population are non-tasters,
that means q2 = 0.30. From that, we can calculate q = 0.55,
and if thats the case, then p = 1.00 0.55 = 0.45. From those, in
turn, we can calculate p2 (the probability or frequency of
TT) as being 0.452 = 20%, and of 2pq (the probability of Tt)
as being 2 × 0.45 × 0.55 = 50%. To check our math, notice that
20% + 50% do, indeed, equal the observed value of 70%. Note that
these percentages are different for other areas of the world, other
ethnic groups.
The PTC molecule contains a NC=S group that is thought to be related
to its bitter taste. This group is also found in several other
bitter-tasting chemicals, including those found in cabbage varieties,
including broccoli, brussels sprouts, and cauliflower, and it has been
noticed that often, people who are TT dislike the taste of those (and
other strongly-flavored) foods, while, in general, non-tasters tend to
be more willing to eat a more varied diet, including more dark-green,
leafy vegetables. It has been suggested that, evolutionarily, this
gene might have been advantageous because many plant toxins taste
bitter, so being able to taste, and therefore avoid, those toxins
might have been beneficial in a hunter-gatherer society.
Thiourea is another chemical that tastes very bitter to some
people (dominant trait) and is tasteless to others (recessive
allele).
A third chemical that tastes different to different people is
sodium benzoate, a controversial food preservative. Typically,
a solution of 0.1% is used for food preservation, and researchers have
shown that a 0.1% solution was tasted by about 25% of the people on
whom it was tested. Interestingly, however, for people who are
tasters, the taste varies. Some people think it tastes sweet, some
salty, some sour, and some bitter.
Taste differences occur for other substances including the barium
sulfate milkshakes fed to people prior to GI X-rays. For most
people this is tasteless, but to some, it is bitter.
- Tongue Rolling: People who can
roll their tongues into a tube have at least one R allele (R) and
those who cant are rr.
- Widows Peak: If your hairline
forms a V on your forehead, you are W and if your hairline is
straight, you are ww.
- Ear Lobes: If your earlobes are
detached, you have at least one E (genotype E), but if they are
attached, you are ee.
- Little Finger: Hold your hand out
with fingers together. If the end joint of your little finger bends
in, you are F. If it is straight, you are ff.
- Hitchhikers Thumb: Hold out your
hand like youre hitchhiking. If your thumb bends back at quite an
angle, you are H. If your thumb is fairly/nearly/almost straight,
you are hh.
- Mid-digital Hair: Look closely at
the middle segments (not knuckles or joints) of all of your
fingers to see if any of them have hair growing on them (If its a
finger you use a lot, the hairs may be worn down to stubble, so look
closely.). If there is any hair on any of them, you are D. If all
your middle segments are totally bald, you are dd.
Considering just these 9 traits, and assuming all are simple
one-gene-with-two-alleles situations would give 29 or 512
different possibilities, and the lab room will only hold 20 students. Note
that, in humans with 23 pairs of chromosomes, a gamete would have
223 = 8,388,604 possible combinations of chromosomes (each
bearing numerous genes) from that parent. Any couple could have
223 × 223 = 70,368,744,177,644 (70 trillion) different
possible children, based just on the number of chromosomes, not actual genes.
Thus, based on the number of chromosomes, the chance of 2 siblings (other
than identical twins) being exactly identical is 1/70 trillion. To make
things even more complex, crossingover, or exchange of segments
between homologous chromosomes during synapsis, can add further
variation.
- Work individually on the coin tosses,
as described below, recording your data on the charts provided along
with your protocol. Since the probabilities involved in genetics exactly
parallel the probabilities of coin tosses, this is an excellent way to
grasp the theory behind genetic probabilities. Once you have all your data,
please
submit your coin toss data
online. When everyone has had a chance to enter their data, you may
view and print the class data
- Most organisms have two sets of
chromosomes, and only one from each pair is passed on, at random, to
the offspring through the process of meiosis by which eggs and sperm
are formed. Thus, since the chromosomes contain or are made up of
genes, the eggs and sperm get only one allele (alternate forms
for genes; allelo = one another, parallel) for each gene.
Obtain a coin. Let us assume that heads represents, say, brown eyes
and tails represents blue eyes, and that this parent has one allele
for brown eyes and one for blue (a heterozygote hetero
= other, different, zygo =a yoke). To illustrate the chances
of having one or the other of these alleles in any particular
gamete (egg or sperm - gamet = a wife or husband),
toss the coin on the tabletop 100 times. Using chicken scratches
record the number of heads and the number of tails on the
chart for Step A.
- To illustrate what happens
when the possible alleles from two heterozygous parents unite in an
offspring, obtain two coins of the same type (say, two pennies).
Toss these, together, onto the tabletop 100 times. Tally and record
in the chart for Step B the numbers of a) two heads, b) one head and
one tail, and c) two tails. As in the previous part, let us assume
that these represent eye color in humans. It is known that in human
eye color, brown eyes is dominant over blue: that is, if an
individual has one allele for brown and one for blue, that individual
will have brown eyes. Thus, in your coin tosses, HH or HT would be
brown-eyed, while TT would be blue-eyed. What ratio of brown to blue eyes
did you get (i. e. what ratio of HH and HT combined versus
TT)?
- In a dihybrid (di =
two) cross, geneticists look at two traits (such as eye color and
tongue-rolling ability) passed on from parents to offspring. Assuming
that the two genes involved are not on the same chromosome, they are
inherited independently of each other. To show the possible
gametes (eggs/sperm) produced by a parent heterozygous for both
traits, obtain two different coins (penny and nickel) and toss them
together 100 times. Record how many of each of the combinations H1+H2,
H1+T2, T1+H2, and/or T1+T2 are obtained. What ratio/percentage of each
were obtained? Record your numbers in the chart for Step C.
- To simulate possible
offspring of a dihybrid cross produced by random union of an
egg and sperm from two parents each heterozygous for two traits
obtain four coins of two types (2 pennies + 2 nickels, etc.) and place
together in a container. Shake thoroughly and toss out onto the
tabletop. Tally the results for 96 such tosses on the
chart for Step D. Rather than figuring out percentages, divide
all your numbers by 6 to obtain how many out of 16 were of that type
(96 ÷ 6 = 16).
Why 16? The probability of getting, for example, H for penny #1 is
½, and the probability of getting H for penny #2 is also ½. Thus, the
probability of getting HH is ½ × ½ = ¼. The same is true for your
nickles (or dimes, or whatever), so the probability of getting
HH + HH would be ¼ × ¼ = ⅟₁₆, the probability of
getting HH + HT would be ¼ × ²⁄₄ = ²⁄₁₆,
etc. Thus it will be much easier to express and understand your final
numbers in terms of how many out of 16, rather than as a percentage.
- Geneticists use Punnett squares
like these
to show what can be expected from a cross between two parent organisms.
First, the possible gametes from each parent are determined (like Steps A or
C above). The possible gametes from the male parent are usually written
across the top of the Punnett square and those from the female parent are
usually written down the left side of the square. From this, the possible
genotypes of the offspring are calculated by filling in the small boxes.
These Punnett squares illustrate Steps A and B above. B represents the
brown-eyed allele, b represents the blue-eyed allele, and HH, HT, and TT
have been converted to the appropriate genotypes. The Punnett square thus
obtained is 2 × 2 or 4 boxes in size. One of the gametes (technically, which
allele ended up in that sperm) from the father has been written above each
column and one of the gametes (technically, which allele ended up in that
egg) from the mother has been written in front of each row. Geneticists
list the dominant allele first. The male gametes have been copied into the
boxes under each and the female gametes into the boxes next to each,
placing the dominant allele first. This gives four possible genotypes for
the offspring, which correspond to the results of Step B above. From this,
figure out the expected frequency/percentage of each genotype and
phenotype of offspring.
- From Steps C and D above, let coin 1 represent some gene, A, where H=A and T=a. Let
coin 2 represent some gene, B, where H=B and T=b.
Draw a Punnett square that is 4 boxes on a side (total of 16 boxes).
Translate the gametes from Step C into A, a, B, and/or b and write in along
the sides of the square (you should have four gametes with one of each gene
for each parent AB, Ab, aB, ab). Remember: gametes should have ONE ALLELE
FOR EACH GENE! Fill in the boxes and the results should match with
what you got in Step D. Note that when doing a dihybrid cross, the A
alleles should be written next to each other and the B alleles should be
kept together. Determine the genotype and phenotype ratios that you would
expect from this cross.
- Individually, examine the monohybrid
(mono = one) and dihybrid crosses illustrated by corn. Count at least
three rows of kernels, but please do not mark on the corn. Ears of corn
representing other genetic combinations may also be available.
What genes are illustrated by these crosses and what are the two alleles
for each of these genes? Which is dominant and which is recessive how can
you tell? Draw Punnett squares for the first filial (F1) and
second (F2) crosses (fili = son or daughter). For each
Punnett square, what genotype and phenotype ratios would be predicted? Count
the kernels of corn. How closely to the predicted phenotype ratios do these
samples come?
- Do the genetics problems listed in
the protocol. The
Genetics Practice Problems Web page
gives a more thorough explanation of how to do these. These are intended
to illustrate various principles of genetics (if you run out of time in lab,
these may/should be done on your own). If you work on these while viewing
the Web page, do not neglect to take notes in your lab notebook.
-
 Using squares to represent males and circles to represent females and using
a white circle/square to represent blue eyes and a black circle/square to
represent brown eyes, draw a pedigree for as much of your family as you are
able (grandparents, parents, aunts, uncles, siblings, cousins, etc.). Notice
in this example, the way a line is drawn between two people to show a
marriage, and notice how the lines are extended below that to indicate their
children. From your family pedigree, can you tell which of the brown-eyed
people are heterozygous? What is your genotype? Can you predict what color
eyes your children might be likely to have? Note: gray eyes are considered to
be a variation on blue, while green, to further complicate things, is a
totally separate gene. Apparently, a person can be dominant or recessive for
the blue/green gene separate from the blue/brown gene, and eye color is
actually influenced by both.
Using squares to represent males and circles to represent females and using
a white circle/square to represent blue eyes and a black circle/square to
represent brown eyes, draw a pedigree for as much of your family as you are
able (grandparents, parents, aunts, uncles, siblings, cousins, etc.). Notice
in this example, the way a line is drawn between two people to show a
marriage, and notice how the lines are extended below that to indicate their
children. From your family pedigree, can you tell which of the brown-eyed
people are heterozygous? What is your genotype? Can you predict what color
eyes your children might be likely to have? Note: gray eyes are considered to
be a variation on blue, while green, to further complicate things, is a
totally separate gene. Apparently, a person can be dominant or recessive for
the blue/green gene separate from the blue/brown gene, and eye color is
actually influenced by both.
 After constructing and contemplating this sample pedigree, it becomes obvious
that the people marked with an asterisk (*) are heterozygous. Can you figure
out why/how? Hopefully, your family pedigree will provide you with similar
information about your family members.
An alternate, more official way to indicate a heterozygote is by using a box
or circle thats half filled in, like this one to the left.
After constructing and contemplating this sample pedigree, it becomes obvious
that the people marked with an asterisk (*) are heterozygous. Can you figure
out why/how? Hopefully, your family pedigree will provide you with similar
information about your family members.
An alternate, more official way to indicate a heterozygote is by using a box
or circle thats half filled in, like this one to the left.
Things to Include in Your Notebook
Make sure you have all of the following in your lab notebook:
- all handout pages (in separate protocol book)
- all notes you take during the introductory mini-lecture
- drawings (yours!) of mitotic stages in onion (Allium) root tip
- drawings (yours!) of mitotic stages in whitefish blastula
- drawings (yours!) of stages in Ascaris
- drawings (yours!) of spermatogenesis in grasshopper
- drawings (yours!) of meiosis to form pollen in lily
- if done, notes on taste-testing (PTC, etc.)
- coin toss data, calculations, and any other related notes
- corn kernel data & calculations
- drawing of ears of genetic corn
- completed genetics practice problems
- family pedigree for eye color
- any other notes and data you gather as you perform the experiment
- print-out of class data (available online)
- answers to all discussion questions, a summary/conclusion in your
own words, and any suggestions you may have
- any returned, graded pop quiz
Copyright © 2004 by J. Stein Carter. All rights reserved.
Based on printed protocol Copyright © 1989 D. B. Fankhauser
and © 1989 J. L. Stein Carter.
Chickadee photograph Copyright © by David B. Fankhauser
This page has been accessed  times since 1 Feb 2011.