Population Growth, Fluctuations, Dispersal, and Territory
Population Growth Curves
 In theory, populations of many organisms have the potential to grow
exponentially. If we let
N0
represent the initial number of organisms in a population,
t represent the time
interval, and
r represent the rate
of increase, then
Nt, the
number of individuals present at time
t,
may be calculated by the formula
Nt = N0(er)t = N0(ert).
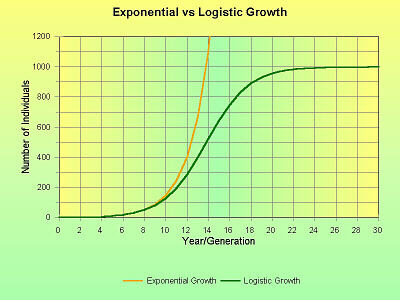
This would be represented by the gold line (J-shaped curve) on the graph to
the right.
In theory, populations of many organisms have the potential to grow
exponentially. If we let
N0
represent the initial number of organisms in a population,
t represent the time
interval, and
r represent the rate
of increase, then
Nt, the
number of individuals present at time
t,
may be calculated by the formula
Nt = N0(er)t = N0(ert).
This would be represented by the gold line (J-shaped curve) on the graph to
the right.
However, for populations in the real world, exponential growth
is not possible. Populations cant continue to grow larger forever because
resources are limited and as density increases, so do competition and
mortality while natality (fecundity) decreases. Thus, population growth
decreases, eventually leveling off at zero population growth. The
carrying capacity (symbolized by
K) for a given
population is the level at which population growth ceases (growth levels off).
At this point, the population is theoretically in equilibrium with its environment, and the equation to predict population size must be modified to include this limit.
Thus, the equation for logistic growth is
| Nt = |
N0 × K
N0 + [(K N0) × (er)t] |
= |
N0 × K
N0 + [(K N0) × ert] |
and is represented by the green line (S-shaped or sigmoid curve) on the
graph to the right, above.
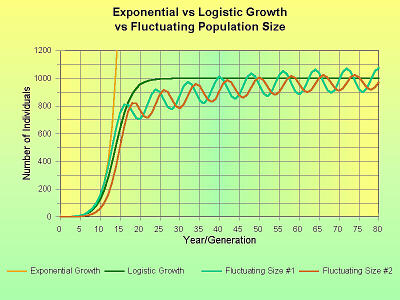 Sometimes because of time lags as populations responds to food or other
environmental conditions, population numbers may fluctuate/oscillate instead
of maintaining a steady level. Classic examples include lynx and snowshoe
hare populations, lemmings, and the relationship between mole and songbird
populations and Periodical Cicadas. Lynx prey on snowshoe hares, so as the
hare population gradually increases, the supply of twigs upon which the
hares feed decreases and the lynx population gradually increases, out of
sync by several years. As the lynx population increases, the snowshoe hare
population decreases due to increased predation (and less twigs per hare).
As the hare population decreases, there is less food for the lynx, so their
population gradually decreases. Thus levels of these two populations
fluctuate in about a nine- to ten-year cycle. Lemming populations typically
fluctuate in three- to four-year cycles. Usually, a year or two before
Periodical Cicadas emerge, while larger larvae are present underground, the
mole population increases in response to the increased food supply, then
after the cicadas emerge, drastically decreases due to starvation. However,
in the year the cicadas emerge, insectivorous songbirds utilize this ready
food supply to feed their young. Thus, in that year, increased numbers of
songbirds successfully fledge, resulting in greater competition for food the
following year, when the cicadas are not present. Thus, to a certain degree,
mole and songbird populations fluctuate in 17-year cycles, influenced by
availability of Periodical Cicadas as food.
Sometimes because of time lags as populations responds to food or other
environmental conditions, population numbers may fluctuate/oscillate instead
of maintaining a steady level. Classic examples include lynx and snowshoe
hare populations, lemmings, and the relationship between mole and songbird
populations and Periodical Cicadas. Lynx prey on snowshoe hares, so as the
hare population gradually increases, the supply of twigs upon which the
hares feed decreases and the lynx population gradually increases, out of
sync by several years. As the lynx population increases, the snowshoe hare
population decreases due to increased predation (and less twigs per hare).
As the hare population decreases, there is less food for the lynx, so their
population gradually decreases. Thus levels of these two populations
fluctuate in about a nine- to ten-year cycle. Lemming populations typically
fluctuate in three- to four-year cycles. Usually, a year or two before
Periodical Cicadas emerge, while larger larvae are present underground, the
mole population increases in response to the increased food supply, then
after the cicadas emerge, drastically decreases due to starvation. However,
in the year the cicadas emerge, insectivorous songbirds utilize this ready
food supply to feed their young. Thus, in that year, increased numbers of
songbirds successfully fledge, resulting in greater competition for food the
following year, when the cicadas are not present. Thus, to a certain degree,
mole and songbird populations fluctuate in 17-year cycles, influenced by
availability of Periodical Cicadas as food.
Population Success and Growth
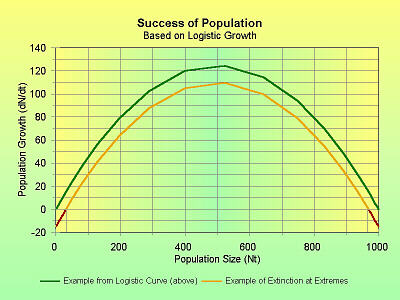 For any population of organisms, there is an optimum population density. If
the density is too high or too low, the rate of growth declines. If there
are too many organisms, the competition for food and other resources is too
great, and many starve or die of other causes. If the population is too
sparse, organsims cant find a mate as easily. The rate of population growth
(ΔN/Δt)
is related to the population density by the equation
For any population of organisms, there is an optimum population density. If
the density is too high or too low, the rate of growth declines. If there
are too many organisms, the competition for food and other resources is too
great, and many starve or die of other causes. If the population is too
sparse, organsims cant find a mate as easily. The rate of population growth
(ΔN/Δt)
is related to the population density by the equation
as illustrated in the graph to the right. The green line corresponds to the
green line for logistic growth in the example illustrated above. If the
growth rate is too low, especially if the rate of increase is less than zero
(note the ends of the gold line on this graph), the population will become
extinct.
Extinction is a natural process, a normal part of
natural selection, thus species (and populations within species) vary in
probability of becoming extinct. Extinction may be caused by a single,
unusual event, such as the mass extinction of dinosaurs due to sudden
environmental changes, or by tremendous ongoing pressure, such as ongoing
human habitat destruction (tropical rainforests, wetland areas) or direct
killing (bison).
Population Density and Dispersion
Factors such as natality, mortality, migration, etc. affect
population density. The density of a species is the number of
organisms of that species per unit area/volume. As discussed in the
Statistical Analysis Worksheet,
distribution patterns (dispersion) within a population are also important.
The dispersion of a species refers to the spatial distribution of the
individuals. Generally, these are arranged in one of three ways: In uniform
dispersion, individuals are evenly scattered throughout the habitat. In
random dispersion, individuals are scattered throughout the habitat at
random. In clumped dispersion, individuals are clustered together in some
locations, while other locations have few/none.
If there is high natality and/or low mortality, a population
can become very dense in a specific area, resulting in increased competition
for resources. Various organisms cope with this in different ways, including
maintaining territories, dispersal (migration), pheromone-triggered decrease
in natality, and/or increased mortality due to greater competition.
Population Dispersal (Migration)
Dispersal (migration) goes on at a fairly constant
rate, but is most
noticeable when the population density is high. There is no general
rule/guideline as to which organisms in the population will disperse, but
often those which leave are sub-adults which have been driven out by
aggressive older adults, and these frequently disperse into submarginal
and/or unoccupied areas/habitats where only some survive and reproduce. In
other cases of dispersal when the population is not under stress, often
stronger, genetically more-fit organisms can/do move to a new habitat. In
these cases, the habitat is usually adequate to good and these individuals
usually survive well (Refer to the
Population Genetics Worksheet,
which discusses the effects of dispersal on the gene pool). Especially in
reference to human populations, the term
immigration
refers to moving into a new place and
emigration
refers to leaving a place.
Population Territories
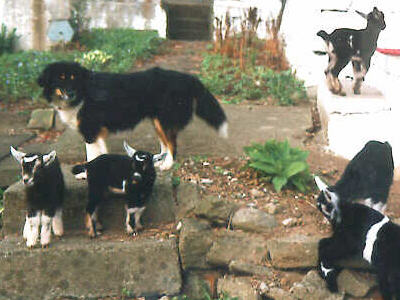 Many animals, either individually or in small family groups, will choose
boundaries for and defend a territory. Humans make use of dogs instinctive
defense of their territory because anyone, including people, kid goats,
lambs, etc., who is recognized as part of the pack is guarded and defended.
Especially in spring, male birds sing to claim their territories and warn
away others of their species, and actual chasing and fighting only occurs if
another male comes into the territory. Male wolves (and pet dogs) mark the
boundaries of their territories with pheromones and other scents in their
urine, and use various body language, such as putting ones tail between
the legs to signify submission or staring as a threat, to maintain the
dominance hierarchy within the pack without bloodshed (which would weaken
the pack overall). The size of territory maintained by an individual or a
group depends on a number of factors, especially the resources available
within it. For example, in a year in which the insect population is higher,
songbirds can maintain smaller territories and still be able to successfully
find enough food to feed their young. In organisms such as wolves, lions,
gorillas, and domestic chickens which live in groups or families, a social
hierarchy or pecking order of some sort is maintained, and the high-ranking
individuals (presumably genetically most fit) get the most food or the best
mates.
Many animals, either individually or in small family groups, will choose
boundaries for and defend a territory. Humans make use of dogs instinctive
defense of their territory because anyone, including people, kid goats,
lambs, etc., who is recognized as part of the pack is guarded and defended.
Especially in spring, male birds sing to claim their territories and warn
away others of their species, and actual chasing and fighting only occurs if
another male comes into the territory. Male wolves (and pet dogs) mark the
boundaries of their territories with pheromones and other scents in their
urine, and use various body language, such as putting ones tail between
the legs to signify submission or staring as a threat, to maintain the
dominance hierarchy within the pack without bloodshed (which would weaken
the pack overall). The size of territory maintained by an individual or a
group depends on a number of factors, especially the resources available
within it. For example, in a year in which the insect population is higher,
songbirds can maintain smaller territories and still be able to successfully
find enough food to feed their young. In organisms such as wolves, lions,
gorillas, and domestic chickens which live in groups or families, a social
hierarchy or pecking order of some sort is maintained, and the high-ranking
individuals (presumably genetically most fit) get the most food or the best
mates.
Copyright © 1999 by J. Stein Carter. All rights reserved.
This page has been accessed  times since 25 Jun 2001.