| Here are the steps Tony followed: |
|---|
| Observation |
|
Tony saw the boy blowing bubbles, and noticed that
the bubbles were all different sizes. Thats when Tony became curious
about the maximum size the boy could produce.
|
|---|
| Question |
|
From that, the question arose in Tonys mind, Whats
the biggest bubble this boy can blow?
|
|---|
| Hypothesis |
|
Remembering to use the metric system, Tony said, I
think this boy should be able to blow bubbles that are about 1 m long,
as long as the wind is not blowing.
|
|---|
| Prediction |
|
Tony thought, If it is true that the boy is
able to blow bubbles 1 m in length when the wind isnt blowing, and
if I use a meterstick to measure the length of some bubbles
when the wind is and is not blowing, then I should be able to
see bubbles of that size when there is no wind, but I should not be
able to see bubbles that large when the wind is blowing.
|
|---|
| Experimental Design |
|
Tony borrowed a meterstick from Farmer Melanie, with
which to measure the bubbles. Tonys control group was to
include 10 bubbles blown when the wind was gusting, and the
experimental group was to include 10 bubbles blown when the wind
was still. Tony planned to calculate the mean and standard deviation
for each group of bubbles.
|
|---|
| Data Collection |
|
Now, Tony was ready to collect some data. Each time
the boy blew a bubble, Tony ran up to it to measure it. Tony could
see that, when the wind was still, many of the bubbles, initially,
looked about the same length as the meterstick, but alas, whenever
Tony tried to place the meterstick directly next to a bubble to
measure it, the bubble popped, and so Tony never got any data.
|
|---|
| Conclusions |
|
Tony was disappointed by the
results and felt that the experiment was a failure. However, then
Tony remembered something from biology class: if the data arent what
you thought youd get, that doesnt mean the experiment is a failure,
but merely that the data show something other than what you intended.
Tony thought about the experiment and realized that what the data
(non-measurements) suggested was that bubbles will pop when touched
with the meterstick and cannot be measured that way. From that, Tony
realized there was a problem with the experimental design that was
being used. Tony decided to alter the experimental design and to,
instead, use a digital camera to photograph each bubble as it was
being blown, then by examining the photographs, compare the length of
the bubbles to the height of the boy (which could easily be measured).
|
|---|
| More Testing |
|
Tony tried collecting data via the new method, and
found that it was fairly easy to photograph the bubbles. The wind
speed (still or gusting) was recorded each time a picture was taken.
The height of the boy was also measured. The photographs were
downloaded onto Tonys computer, and the sizes of the bubbles were
compared with the height of the boy. When the averages were
calculated, Tony found that the average bubble length in still air was
97 cm and in wind gusts was 63 cm. From that, Tony was able to
conclude that, indeed, the data supported the hypothesis that in still
air, the boy was able to blow bubbles of about 1 m in length.
Tony also remembered that an experimental conclusion is only good for
the conditions under which the experiment was conducted, and realized
that if it would be raining, if the concentration of the bubble
juice would change (if someone decided to dilute it), or if the
experiment were to be repeated in winter, any of those factors could
change the outcome.
|
|---|
The following Web pages contain information related to
the scientific method.
Is there something around your house or yard that can be
studied via the scientific method? For example, will too much candy really
make your child hyper? Does fertilizer really help grass or do coffee
grounds help houseplants to grow better? Are there any interesting
things youve observed and about which youre curious? For example, have you
noticed that if you eat breakfast, you seem to have more energy throughout
the day or that it seems like, every time you eat wheat, 2 hr later, you
have a stuffy nose?
To illustrate how the Scientific Method can be used as a tool to solve
problems and answer questions, based on your own curiosity about the world
around you, you are asked to go through all the steps involved in designing
and doing a simple experiment. Dont think that you have to come up with
something grandiose and complicated! Remember KISS: Keep It
Simple!
For those of you with children, this might be a project in which they could
be involved.
Note that to help you get a better grade on this assignment, you are asked
to submit your experimental plan, first, and get that graded before
you actually perform your experiment. That way, if there are problems with
your experimental design, you will have an opportunity to correct those,
before you actually do anything, thereby improving your chances of a successful
and meaningful experimental outcome.
The grading criteria for this assignment are given below, and
you should also refer to those as you work on the assignment.
A total of 52 points is possible.
| 1. Background Thinking: |
|---|
| 2 | | The observation was present and clearly stated |
| 1 | | An observation was present, but vague and not clearly stated or not obviously related to the experiment |
| 0 | | The observation was missing |
 |
|---|
| 2 | | The question was present and clearly stated |
| 1 | | A question was present, but not clearly stated or unrelated to the experiment |
| 0 | | The question was missing |
|
|---|
| 2 | | The hypothesis was present and clearly stated |
| 1 | | An hypothesis was seemingly present, but not clearly stated or not really an hypothesis and/or unrelated to the experimental procedure |
| 0 | | The hypothesis was missing |
|
|---|
| 2 | | The prediction was present and clearly stated |
| 1 | | A prediction was seemingly present, but not clearly stated or not really a prediction |
| 0 | | The prediction was missing |
|
|---|
| 2 | | The prediction was correctly based on and derived from the hypothesis and proposed experiment |
| 1 | | The prediction was only partially related to the hypothesis and procedure |
| 0 | | The prediction was unrelated to the hypothesis and procedure, and thus, wasnt really a prediction |
| 2. Methods and Materials: |
|---|
| 2 | | The procedure was clearly thought-out and stated |
| 1 | | The procedure, as given, was somewhat vague or confusing |
| 0 | | The procedure was missing or was so vague/confusing that it was very difficult or impossible to understand |
|
|---|
| 2 | | Both a control group and an experimental group were specified |
| 1 | | One or the other group was missing |
| 0 | | Both the control and experimental groups were missing |
|
|---|
| 2 | | There was adequate replication/repetition 3 or more test subjects in both the control and experimental groups |
| 1 | | There was some replication, although not enough less than 3 test subjects in one or the other group |
| 0 | | There was no replication only 1 test subject in all of the groups |
|
|---|
| 2 | | There only one variable everything else was the same in both the control and experimental groups |
| 1 | | Some variables were overlooked and, unintentionally, not carefully controlled |
| 0 | | There was too many planned variables |
|
|---|
| 2 | | The data to be gathered and methods of gathering them were clearly explained |
| 1 | | The data and methods of measuring them were partially missing or were explained in a vague and confusing manner |
| 0 | | The data to be gathered were not specified |
|
|---|
| 2 | | The means of analyzing the data were clearly stated and explained |
| 1 | | The explanation of the data analysis was vague and confusing or partially missing |
| 0 | | The data analysis was not specified |
|
|---|
| 2 | | All needed equipment and supplies were specified/included |
| 1 | | While some of the equipment/supplies were given, other necessary items were missing and/or unnecessary items were included |
| 0 | | Much/all of the necessary equipment/supplies were not specified or most of the items included were unrelated to the experiment |
|
|---|
| 2 | | Where necessary, the author gave supporting reasons to justify the proposed procedure to be followed |
| 1 | | It was not always clear why certain steps were being performed |
| 0 | | The reasoning behind the procedure was missing it was not at all clear why this procedure was being followed |
| 3. Data: |
|---|
| 2 | | All of the actual data collected were included |
| 1 | | Some of the necessary data were missing or appeared to be fictitious |
| 0 | | No data were presented or all alleged data appeared to be fictitious |
|
|---|
| 2 | | The data were presented in a logical, organized manner |
| 1 | | The presentation of the data was somewhat confusing or redundant |
| 0 | | Data were seemingly present, but presented in an unintelligible, confusing manner |
|
|---|
| 2 | | A valid analysis of the data (averages, etc.) was done, was included, and was clearly presented |
| 1 | | Some data analysis that should have been included was not |
| 0 | | No evidence of data analysis was presented/included |
|
|---|
| 2 | | All units and measurements were given in the metric system |
| 1 | | A mixture of English and metric system units was used |
| 0 | | All measurements were given in English system or units were never given and it was unclear what system was being used |
|
|---|
| 2 | | All numbers were clearly labeled with units |
| 1 | | The units for some numbers were not specified, and/or it was unclear what some numbers represented |
| 0 | | Most/all of the numbers were unlabeled and it was unclear what they represented |
| 4. Conclusions: |
|---|
| 2 | | Conclusions were drawn from the experiment that was done |
| 1 | | Some conclusions were included that are merely restatements of portions of the data |
| 0 | | No conclusions were drawn from this experiment |
|
|---|
| 2 | | The conclusions were based upon and supported by quotes of the actual data |
| 1 | | Some of the conclusions are merely repetitions of the data and/or conclusions are presented without being backed up by data |
| 0 | | The conclusions were not based on the data, and some/all of them are the opposite of what the data indicate |
|
|---|
| 2 | | The conclusions that were reached were reasonable for the data that were obtained |
| 1 | | Some of the conclusions were unreasonable and far-fetched for the data that were obtained |
| 0 | | The conclusions were totally speculative or in opposition to the data |
|
|---|
| 2 | | It is obvious that much careful thought was given to the validity of the experiment and any possible flaws in the experimental design |
| 1 | | Adequate thought was given to possible flaws in the experimental design |
| 0 | | Little or no thought was given to possible problems with the experimental design |
|
|---|
| 2 | | This experiment obviously piqued the authors curiosity and generated much thought regarding further questions and experimentation |
| 1 | | Adequate thought was given to further questions and future experiments |
| 0 | | No curiosity was evident little or no thought was given to possible further study |
| 5. Overall Effort and Thought: |
|---|
| 2 | | Each section contained only material appropriate to that section (no data in Methods and Materials, etc.) |
| 1 | | There were a few cases where something was in the wrong section |
| 0 | | Much material was presented out-of-order, in the wrong section |
|
|---|
| 2 | | The student, obviously, went beyond the minimum requirements of the assignment |
| 1 | | The student adequately completed the assignment |
| 0 | | The student completed considerably less of the assignment than what was required |
|
|---|
| 2 | | It is evident that the student used much insight, thoughtfulness, and critical thinking when completing this assignment |
| 1 | | The student adequately thought about the assignment there was, perhaps, a bit of fuzzy thinking in a couple places |
| 0 | | The assignment gives the appearance of being slapped together just to get it done, with little evidence of thoughtfulness |
| Total Possible: |
|---|
| 52 | | total points |
 t
the volleyball picnic was a boy who was blowing bubbles.
t
the volleyball picnic was a boy who was blowing bubbles.
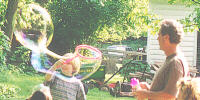 Tony, a Clermont grad and former biology student, wondered, Whats the biggest bubble this boy can blow? and decided to conduct an experiment to
determine the answer to that question. Tony had learned in biology class that the Scientific Method is a logical sequence of steps that
a scientist uses to answer a question, solve a problem, and/or to make new discoveries,
and thus, Tony decided to use the steps in the Scientific Method to
determine how large of a bubble the boy could blow.
Tony, a Clermont grad and former biology student, wondered, Whats the biggest bubble this boy can blow? and decided to conduct an experiment to
determine the answer to that question. Tony had learned in biology class that the Scientific Method is a logical sequence of steps that
a scientist uses to answer a question, solve a problem, and/or to make new discoveries,
and thus, Tony decided to use the steps in the Scientific Method to
determine how large of a bubble the boy could blow.