Spectrophotometer Use and Beers Law
What Does Light Have to Do with Biology?
 Light, more specifically how light is absorbed, is very
important to living organisms. Perhaps the most obvious example would be
that of photosynthesis, in which the chlorophyll in plants absorbs light
energy and uses that to make sugar, which in turn, serves as a source of
fuel for the majority of the organisms on Earth. Consider, however, that
water absorbs light, or more specifically, water absorbs certain colors of
light more than other colors. That would affect what sorts of living
organisms could live in water, and how deep they could live. A photosynthetic
organism (plants, algae) would have to be able to absorb the colors of light
that the water did not absorb (and therefore were left-over and
available for those organisms, plus those photosynthetic organisms could
only live as deep in the water as a sufficient amount of light was able to
penetrate.
Light, more specifically how light is absorbed, is very
important to living organisms. Perhaps the most obvious example would be
that of photosynthesis, in which the chlorophyll in plants absorbs light
energy and uses that to make sugar, which in turn, serves as a source of
fuel for the majority of the organisms on Earth. Consider, however, that
water absorbs light, or more specifically, water absorbs certain colors of
light more than other colors. That would affect what sorts of living
organisms could live in water, and how deep they could live. A photosynthetic
organism (plants, algae) would have to be able to absorb the colors of light
that the water did not absorb (and therefore were left-over and
available for those organisms, plus those photosynthetic organisms could
only live as deep in the water as a sufficient amount of light was able to
penetrate.
Light absorption affects living organisms in other ways, too.
Photosynthesis can only happen as deep in a plant leaf as light is able to
penetrate. As light passes into a leaf, the chlorophyll absorbs those colors
which are useful for photosynthesis, and the deeper into the leaf the light
goes, the less is left. That means there would be a limit to the thickness
of a leaf if photosynthesis is to occur throughout the leaf, and thats
probably related to why, in general, leaves are thin and flat, and most plants
dont do photosynthesis in their stems.
 Turtles sunning themselves on a log
in a pond are absorbing infrared (IR) light to warm up their bodies. Our
bodies are able to absorb certain wavelengths of ultraviolet (UV) light and
use that light energy to transform cholesterol into vitamin D, the sunshine
vitamin. However, that process happens in our skin, and once that light
has been absorbed and put to use, little, if any, of it makes it deeper into
our bodies.
Turtles sunning themselves on a log
in a pond are absorbing infrared (IR) light to warm up their bodies. Our
bodies are able to absorb certain wavelengths of ultraviolet (UV) light and
use that light energy to transform cholesterol into vitamin D, the sunshine
vitamin. However, that process happens in our skin, and once that light
has been absorbed and put to use, little, if any, of it makes it deeper into
our bodies.
Light absorption is also important to biologists as they
study living organisms. Chlorophyll could be extracted from a leaf at a
known dilution, and a spectrophotometer could be used to compare the
light absorbed by that sample with the light absorbed by a standard solution
whose concentration is known to determine the concentration of chlorophyll
in the sample. Similarly, riboflavin (vitamin B2) is yellow colored, so it
would be possible to study how much a persons body needs/uses by taking a
known dose, then saving urine samples, checking those to see how much light
they absorb, and comparing that with known standard solutions to determine
how much riboflavin was excreted.


Additionally, in this lab, you will learn how to use a
pipet (used as a noun), or how to pipet (used as a verb). That skill
is an extremely important technique which is frequently used in both biology
and chemistry, and one which is only mastered by practice. Thus, a big
part of this lab exercise will be to practice and learn how to use a pipet
to measure and dispense small quantities of liquids. Thus, in this lab
exercise, the principle known as Beers Law will be used to develop
and perfect students pipetting skills: if the pipet is used correctly, if
the spectrophotometer is read correctly, and if the persons final graph is
constructed correctly, each persons data should, hypothetically, form a
straight line graph.
Errors in reading the pipet, delivering the correct amount of liquid, and/or
reading the dial on the spectrophotometer will lead to a graph which is not a
straight line. The challenge, then, is to do it right, thereby getting a
nearly-straight line on ones graph.
Background on Riboflavin
 Because of its importance as a vitamin and the important biological roles that
it plays, as well as its easily-noticed, bright-yellow color, we will be
using riboflavin as our test subject in todays lab.
Because of its importance as a vitamin and the important biological roles that
it plays, as well as its easily-noticed, bright-yellow color, we will be
using riboflavin as our test subject in todays lab.
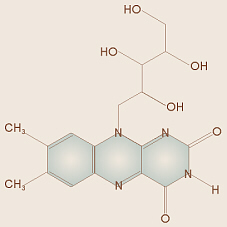
Riboflavin is also known as vitamin B2. It is a bright yellow color, and as
such, is the vitamin that gives the yellow color to B vitamin supplements.
Its chemical formula is
C17H20N4O6, and its molecular
weight is 376.36 g/m.
There are several wavelengths of light in the UV
range at which it has an absorption peak, the longest being at 370 nm.
In the visible range, it has an absorption peak at 450 nm in the blue range,
and a minimum after 550 nm in the greenish-yellow to yellow range.
It also fluoresces: it absorbs light in the UV-blue range, and
later releases some of that energy as heat and some as lower-energy light in
the greenish-yellow range.
B2, riboflavin, was formerly known as vitamin G.
It aids in maintenance of oral mucosa and skin, and is involved in many
aspects of energy and protein metabolism, playing a role in the
FAD+-FADH redox reaction. A deficiency causes skin and mucous
membrane lesions.
As a water-soluble vitamin, it is not stored in
our bodies, and any excess, beyond immediate needs, is excreted in the urine.
Thus, people who take B vitamin supplements may be familiar with the bright
yellow color that it turns their urine.
The RDA is about 1.6-1.7 mg/day for males, and about 1.2-1.3 mg for females.
Foods that are good sources include nutritional yeast, milk and cheese, eggs,
almonds, quinoa, buckwheat, some grains, and meats.
Background on Beers Law
Before discussing what Beers Law is/says, there is a
misconception prevalent among freshman biology students that must be cleared
up. Dr. August Beer was a German physicist and mathematician who also did
some chemistry-related research. He was born in 1825, received his Ph. D.
in 1848, and died in 1863. In contrast, the German word for that beverage
known in English as beer has nothing to do with him! The
German word for that beverage is Bier, which is totally different
than his name.
Pierre Bouguer in 1729, and Johann Heinrich Lambert in 1760,
both said that for a solution of a light-absorbing chemical such as
riboflavin or chlorophyll, the thickness (distance)
of solution through which the light must pass affects how much light it
absorbs. For example, a 2 cm thick layer of solution will absorb more
light than a 1 cm thick layer of solution.
 In 1852, Dr. Beer added to that by saying the concentration of
the solution also affects how much light is absorbed. Thus, for example, a
6 M solution will absorb more light than a 4 M solution of the same chemical.
This can be expressed mathematically.
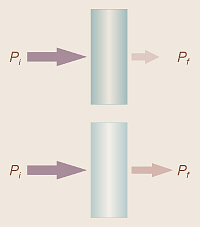
If we let Pi stand for the initial amount or power of the
light which is shining on a sample, the initial amount of light before
it goes through the sample, and Pf the final amount of
light left after it goes through the sample, then as the sample absorbs some
of the light, Pf will be less than Pi.
We can, then, talk about the amount of light that is transmitted (the amount
that did get through). This is called the transmittance, T,
and these three numbers are related by
In 1852, Dr. Beer added to that by saying the concentration of
the solution also affects how much light is absorbed. Thus, for example, a
6 M solution will absorb more light than a 4 M solution of the same chemical.
This can be expressed mathematically.
If we let Pi stand for the initial amount or power of the
light which is shining on a sample, the initial amount of light before
it goes through the sample, and Pf the final amount of
light left after it goes through the sample, then as the sample absorbs some
of the light, Pf will be less than Pi.
We can, then, talk about the amount of light that is transmitted (the amount
that did get through). This is called the transmittance, T,
and these three numbers are related by
T = Pf /Pi
Some chemists use the term percent transmittance,
%T, such that
%T = 100 × Pf /Pi
Chemists also use the term absorbance (the number we
will be measuring in this lab) symbolized by
A, which is equal to the logarithm of 1/T, or
A = log(1/T)
Notice, by the way, the proper term is absorbANCE, not
absorbency which refers to (among other things) how much water a baby
diaper, for example, can hold.
As previously mentioned, absorbance is related to the length
of the path the light must travel through the absorbing medium and the
concentration of the solution. It has been found that this is a direct
relationship, so that if the length is symbolized by b and the
concentration is symbolized by C (not to be confused with the speed
of light, symbolized by c), this can be expressed mathematically as
A = bCK
where K is a constant value for each kind of chemical.
This is called Beers Law. Thus, note that for several concentrations,
several solutions, of the same chemical, if you make a graph of A
versus C, you should have pretty close to a straight line because if
all youre changing is the concentration, then b and K stay the
same.
It is possible, then, to make use of an instrument called a spectrophotometer
(spectro = a sight, the spectrum; photo = light; meter
= measure) to study various concentrations of solutions and even predict the
concentration of an unknown solution using the amount of light the solution
absorbs.
Background on Light
 As background information for this lab, we need to discuss
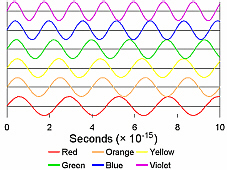
several of the properties of light. First, all colors of light travel at a
speed of 3 × 1010 cm/s, symbolized by c. Typically,
light is thought of as waves, so each color has its own wavelength (the
distance between any two adjacent crests or between any two adjacent troughs
of the wave), symbolized by λ (lambda) and
its own frequency, symbolized by f. The wavelength is a measurement
of the length/distance of each wave, and the frequency is how many of those
waves go past a given point in a given amount of time. Since all light
travels at the same speed, that means that the shorter the wavelength of
a particular color, the more waves of that color pass in a given time. Thus,
these three quantities are related to each other in the following manner:
As background information for this lab, we need to discuss
several of the properties of light. First, all colors of light travel at a
speed of 3 × 1010 cm/s, symbolized by c. Typically,
light is thought of as waves, so each color has its own wavelength (the
distance between any two adjacent crests or between any two adjacent troughs
of the wave), symbolized by λ (lambda) and
its own frequency, symbolized by f. The wavelength is a measurement
of the length/distance of each wave, and the frequency is how many of those
waves go past a given point in a given amount of time. Since all light
travels at the same speed, that means that the shorter the wavelength of
a particular color, the more waves of that color pass in a given time. Thus,
these three quantities are related to each other in the following manner:
c cm/s = λ cm/wave × f wave/s,
which can be shortened to c = λf
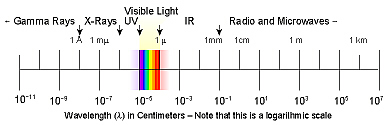 Visible light is only a small portion of the electromagnetic spectrum,
which also included gamma rays, x-rays, ultraviolet light, infrared light,
(ultra = beyond; infra = below, beneath)
radio waves, and microwaves. Since the wavelengths of these waves vary
greatly, a review of distance measurement names and relationships might
be of use.
Visible light is only a small portion of the electromagnetic spectrum,
which also included gamma rays, x-rays, ultraviolet light, infrared light,
(ultra = beyond; infra = below, beneath)
radio waves, and microwaves. Since the wavelengths of these waves vary
greatly, a review of distance measurement names and relationships might
be of use.
| 1 m (meter) |
|
|
|
|
|
| 0.1 m |
1 dm (decimeter) |
|
|
|
|
| 0.01 m |
1 cm (centimeter) |
|
|
|
|
| 1 × 10³ m |
0.1 cm |
1 mm (millimeter) |
|
|
|
| 1 × 10⁴ m |
0.01 cm |
0.1 mm |
|
|
|
| 1 × 10⁵ m |
1 × 103 cm |
0.01 mm |
|
|
|
| 1 × 10⁶ m |
1 × 104 cm |
1 × 103 mm |
1 μ (micron) |
|
|
| 1 × 10⁷ m |
1 × 105 cm |
1 × 104 mm |
0.1 μ |
|
|
| 1 × 10⁸ m |
1 × 106 cm |
1 × 105 mm |
0.01 μ |
|
|
| 1 × 10⁹ m |
1 × 107 cm |
1 × 106 mm |
1 × 10³ μ |
1 mμ (millimicron)
1 nm (nanometer) |
|
| 1 × 10¹⁰ m |
1 × 108 cm |
1 × 107 mm |
1 × 10⁴ μ |
0.1 mμ
0.1 nm |
1 Å (Ångström) |
(milli = one thousand; micro = small; nano = a dwarf)
Thus, the relationships among wavelength, frequency, and
energy of various colors of visible light can be summarized as in the
following chart. It is important to notice that as wavelength increases,
frequency and energy decrease. Thus, for example, ultraviolet light, with
wavelengths of less than 400 nm, has both a higher frequency and higher
energy than visible light, while infrared, with wavelenghts of over 800 nm
has a lower frequency and energy.
Just to explain some of the following numbers in case you are
wondering what they mean, if for example,
we look at the calculations for light with a wavelength of 350 nm:
if, from above,
c = λf, then f = c/λ
thus, f = (3 = 1010 cm/s) ÷ (3.50 × 10² nm/wave × 107 cm/nm)
= 3/3.5 × 10102+7 wave/s
= 0.857 × 10¹⁵ wave/s
= 8.57 × 10¹⁴ wave/s
Also, just as a brief explanation of a more complicated physics
thing (just so you know these numbers didnt just come out of thin air, but
do have a rationale behind them), the energy of each color/wavelength of
light is proportional to its frequency, with the relationship,
E = hf,
where the h is something called Plancks constant and is
equal to 6.63 × 1027 erg-s. Then, to continue the above
example:
8.57 × 10¹⁴ wave/s × 6.63 × 1027 erg-s = 8.57 × 6.63 ×101427 wave-ergs
= 56.8 × 10¹³ wave-ergs
= 5.68 × 10¹² wave-ergs
typically epressed as just 5.68 × 10¹² ergs
Then, for convenience, physicists and chemists convert from
ergs to electron volts (eV) by using the converstion factor of
1.60 × 10¹² erg/eV
5.68 × 10¹² ergs ÷ 1.60 × 10¹² erg/eV = 5.68 ÷ 1.60 × 10¹²+12 eV
= 3.55 eV
For the sake of comparison, audible sounds are waves of
compressed air that are considerably slower-moving than light, at around
340 m/s. Middle C has a frequency of 262 waves/s, and the A above
middle C has a frequency of 440 waves/s. Thus, the corresponding wavelengths
would be:
340 m/s ÷ 262 waves/s = 1.298 m/wave (= 4.26 ft)
340 m/s ÷ 440 waves/s = 0.773 m/wave (= 2.54 ft)
Visible light, that which can be seen by the human eye, is
only a small portion of a larger spectrum known as the electromagnetic
spectrum. Visible light can be further subdivided by what we
call color. Note that if white light is passed through a solution that
absorbs certain wavelengths while others are transmitted, we see only the
wavelengths that are transmitted and thus, hit our eyes, not those that are
absorbed.
Wavelength
(nm/wave) |
Frequency
(waves/sec) |
Energy
(eV) |
Approx
Color & RGB equivalent |
| 350 |
8.57 × 10¹⁴ |
3.55 |
UV |
|
(no RGB) |
| 375 |
8.00 × 10¹⁴ |
3.32 |
UV |
|
(no RGB) |
| 400 |
7.50 × 10¹⁴ |
3.11 |
V |
|
(131,0,181) |
| 425 |
7.06 × 10¹⁴ |
2.92 |
V |
|
(84,0,255) |
| 450 |
6.67 × 10¹⁴ |
2.76 |
B |
|
(0,70,255) |
| 475 |
6.32 × 10¹⁴ |
2.62 |
BG |
|
(0,192,255) |
| 500 |
6.00 × 10¹⁴ |
2.49 |
BG-G |
|
(0,255,146) |
| 525 |
5.71 × 10¹⁴ |
2.37 |
G |
|
(74,255,0) |
| 550 |
5.45 × 10¹⁴ |
2.26 |
YG |
|
(163,255,0) |
| 575 |
5.22 × 10¹⁴ |
2.16 |
Y |
|
(240,255,0) |
| 600 |
5.00 × 10¹⁴ |
2.07 |
O |
|
(255,190,0) |
| 625 |
4.80 × 10¹⁴ |
1.99 |
R |
|
(255,99,0) |
| 650 |
4.62 × 10¹⁴ |
1.91 |
R |
|
(255,0,0) |
| 675 |
4.44 × 10¹⁴ |
1.84 |
R |
|
(255,0,0) |
| 700 |
4.29 × 10¹⁴ |
1.78 |
R |
|
(255,0,0) |
| 725 |
4.14 × 10¹⁴ |
1.71 |
R |
|
(209,0,0) |
| 750 |
4.00 × 10¹⁴ |
1.66 |
R |
|
(161,0,0) |
| 775 |
3.87 × 10¹⁴ |
1.60 |
R |
|
(109,0,0) |
| 800 |
3.75 × 10¹⁴ |
1.55 |
IR |
|
(no RGB) |
(If youre interested in exploring this further, one
interesting Web site I found is a Wavelength to RGB Converter.)
Different chemicals absorb different amounts of light of
different colors. The colors of light that are absorbed by a chemical
(pigment) are, thus, not available for our eyes to see. The colors that are
not absorbed are whats left over, whats reflected back and
available to enter our eyes and be seen.
For example:
| Pigment |
Maximum
Light
Absorbance |
Minimum
Light
Absorbance |
| Chlorophyll A |
428 nm ( ) and
660675700 nm ( ) |
~525 nm ( ) |
Chlorophyll B |
453 nm ( ) and
643 nm ( ) |
~525 nm ( ) to
550 nm ( ) |
| Thats why chlorophyll looks green (and why Chlorophyll A
looks more of a blue-green color, while Chlorophyll B looks more of a
pea-green color. |
| βCarotene |
451 nm ( ) |
~600 nm ( ) |
| Methylene Blue |
668 nm ( ) and
609 nm ( ) |
~400 nm ( ) to
425 nm ( ) |
| Riboflavin |
370 nm ( UV ) and
450 nm ( ) |
~550+ nm ( ) |
| Thats why riboflavin
looks yellow and why, for this
lab, we will be setting the spectrophotometer to a wavelength of
450 nm. To reiterate, riboflavin looks yellow because that is the
light that it is not absorbing. One of the colors of light of
which it absorbs the most and which we will be examining in this lab is
at 450 nm, in the blue range what it absorbs is what we cannot
see. |
Thus, in general (note slight variation between the two sources
that were consulted):
λ in nm
(source #1) |
λ in nm
(source #2) |
approx. color seen when transmitted or reflected |
| 400-435 | 400-424 | violet |
| 435-480 | 424-491 | blue |
| 480-490 | | green-blue |
| 490-500 | | blue-green |
| 500-560 | 491-575 | green |
| 560-580 | | yellow-green |
| 580-595 | 575-585 | yellow |
| 595-610 | 585-647 | orange |
| 610-750 | 647-700 | red |
Parts of the Spectrophotometer & How It Works
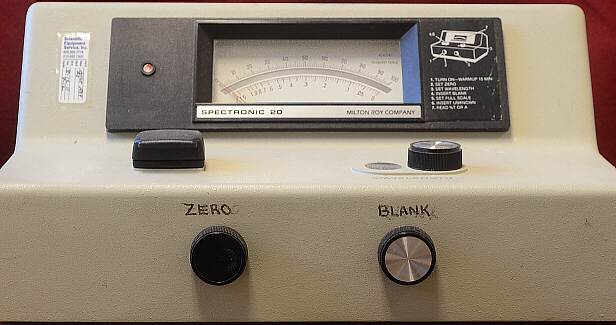
Note, these instructions are for the old Spectronic 20s. We
now are using new Spectronic 200s. Some of the instructions, here, will
be the same, but others have changed. Refer to the
Use of Spectronic 200
Web page for more information on how to use those spectrophotometers.
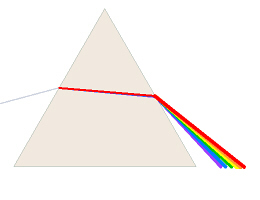
A spectrophotometer has a light source, usually a special
light bulb. The light passes through a narrow slit or lens to focus it into
a small beam and then through a diffraction grating which disperses the
light into a spectrum, similar to the dispersion of light by a prism.
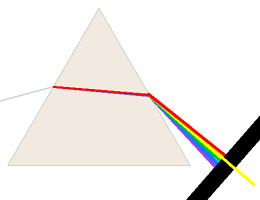
 As white light passes through a diffraction grating or prism,
the light is bent. Red light, for example, (lower energy, lower frequency,
longer wavelength) is bent less than violet light (higher energy, higher
frequency, shorter wavelength), thus a spectrum is created. The
spectrophotometer has another fine slit to let only a narrow band of the
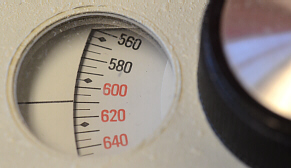
colored light go through. The color is chosen/adjusted by a knob which
focuses a different portion of the spectrum on/through the slit. The light
then passes through the sample to a detector (a photoelectric cell) which is
electrically connected to the meter on the machine.
As white light passes through a diffraction grating or prism,
the light is bent. Red light, for example, (lower energy, lower frequency,
longer wavelength) is bent less than violet light (higher energy, higher
frequency, shorter wavelength), thus a spectrum is created. The
spectrophotometer has another fine slit to let only a narrow band of the
colored light go through. The color is chosen/adjusted by a knob which
focuses a different portion of the spectrum on/through the slit. The light
then passes through the sample to a detector (a photoelectric cell) which is
electrically connected to the meter on the machine.
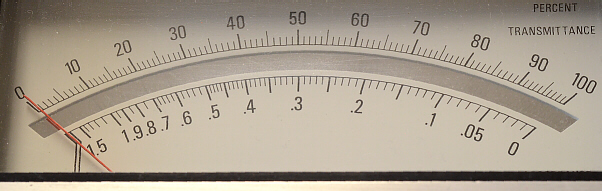
Many spectrophotometers, including those here in the biology
lab, have both Absorbance (A) and Percent Transmission (%T) on their scales.
For this course we will use only the Absorbance (A) scale. Due to factors
within the machine itself, and due to the fact that any solvent used (water
alcohol, etc.) absorbs light and, in fact, absorbs more of certain
wavelengths/colors of light than others, before using the machine, it must
 be calibrated; the maximum and minimum A must be set to compensate for those
factors. When there is no specimen in the machine, it must be told that
things are totally dark, all the light is being absorbed, no light is getting
through to the detector. When there is a specimen of plain, pure solvent
(water, alcohol, or whatever is being used) in the machine, it must be told
to ignore any light that is absorbed by that solvent and/or the glass in
the cuvette that is used to hold the sample, and pretend that
all of the incoming light is going through the specimen and is being received
by the detector. That way, when samples are tested, the machine will report
only the light that is absorbed by the solute in question.
be calibrated; the maximum and minimum A must be set to compensate for those
factors. When there is no specimen in the machine, it must be told that
things are totally dark, all the light is being absorbed, no light is getting
through to the detector. When there is a specimen of plain, pure solvent
(water, alcohol, or whatever is being used) in the machine, it must be told
to ignore any light that is absorbed by that solvent and/or the glass in
the cuvette that is used to hold the sample, and pretend that
all of the incoming light is going through the specimen and is being received
by the detector. That way, when samples are tested, the machine will report
only the light that is absorbed by the solute in question.
Pipets and Pipetting
There are a number of exercises and experiments in this and
your other Biology courses in which you will need to accurately measure a
small amount of liquid. This is typically done by using a pipet
via the process called pipetting, and thus, one of the goals of this
lab exercise is to learn how to use a pipet.


The pipets here in the Biology Lab are serological (sero = serum, whey)
pipets, which have a slightly different design than the pipets you may have
used in Chemistry Lab. Serological pipets are calibrated such that the last
drop of liquid should be blown out, and the markings go all the way to the
tip. For this lab, we will be using 1-mL and 5-mL pipets. Note the various
markings, bands, and color-coding on each of those sizes.
Do not mouth pipet while the pipets, themselves, are clean
and sterile, in the future you will be pipetting solutions that you wouldnt
want in your mouth.
We will be using Beers Law to test the accuracy of your
pipetting technique. You will be making solutions of varying concentrations
of riboflavin, using pipets to measure the specified volumes of water and
riboflavin. In theory, if you have pipetted accurately, Beers Law says that
a graph of concentration versus absorbance should be a straight line. The
less accurately you measure the water and/or riboflavin, the farther from a
straight line your data points will be. How close can you get?
Serial Dilutions
While this is not the case for the riboflavin solution we will
be using, stock solutions of some chemicals may be too concentrated to use
as-is and may first need to be diluted. However, if we dont need to use
very much of that chemical, we wouldnt want to waste a lot of water to
dilute all of it. For example, if we would start with 100 mL of stock
solution and need to do a 100x dilution, if wed use the whole thing, wed
end up with a final volume of 10 L, out of which, we might only need to use
a few
milliliters. By performing a serial dilution, we can obtain the same
final concentration, and have enough solution to use, yet need only about
9 mL of water.
In a serial dilution, aliquots of the stock solution are
diluted stepwise such that the first dilution serves as the source from which
an aliquot is taken for the second dilution, etc. In a two-step serial
dilution, someone could first add 0.5 mL of a stock solution to
4.5 mL of dH2O. This means that each 0.5 mL aliquot will be
diluted to 5.0 mL thus the volume has increased 10 times, yet that 5 mL
contains the same amount of actual riboflavin as the 0.5 mL from which it was
made. Therefore, the new solution is 10 times as dilute (has a dilution
factor of 10 or 101).
Another way to look at this is to say that it is 1/10 as concentrated (has a
concentration factor of 1/10 or 101).
If, in a second
step, 0.5 mL of that new solution is again diluted to 5.0 mL, then the resulting
solution is 100 times as dilute as the initial stock solution, or we could
say that it is 102 times as concentrated as the initial stock
solution. In this case, by doing a serial dilution, weve used only 0.5 mL
of stock solution, and by using a total of only 9 mL of water, have created
5 mL of a solution thats only 1/100 as concentrated as the initial stock
solution. If this was not done via a serial dilution, and instead, that
0.5 mL of stock solution was directly diluted 100×, wed need to use 49.5 mL
of water and end up with 50.0 mL of dilute solution. If, wed continue the
serial dilution one more step, we would arrive at a 103 dilution
using only 13.5 mL of water instead of the 499.5 mL that would be needed to
directly dilute 0.5 mL of stock 1000×.
Gathering Equipment
You should work individually on this lab. Each person
MUST learn how to use a pipet and practice using it. We will be
doing labs where you will be working individually and
will need to know how to pipet! You will need the following equipment:
- Spectrophotometer these should
already be out on the lab tables and warming up. If not, you will need to
turn on the spectrophotometer and let it warm up for at least 30 min. before
use.
- A 1-mL
pipet and a 5-mL
pipet as well as a pipet bulb or pipet filler. The type of pipet
bulb we will be using is called a Brinkmann® Pipet Helper. Note that
the canisters of pipets
have been sterilized, and pipets from those canisters are used by other
students and faculty for a variety of tasks in which maintaining sterility is
important. Thus, while we dont need to maintain a sterile environment for
todays lab, we do need to use proper sterile technique when removing a pipet
from the canister so that the remaining pipets in the canisters do not become
contaminated. To lessen the possibility of contamination in the canisters,
you should
- only open the canisters while
they are horizontal (on a table) to decrease the chance of
airborne bacteria falling into them do not place open canisters
in a position such that they are open-end-up,
- when you remove the lid from
a canister, set it on its side so that the open end is not facing
upward,
- only touch the top end of the
particular pipet you are withdrawing, and immediately withdraw that
pipet, and
- immediately put the lid back
on the canister.
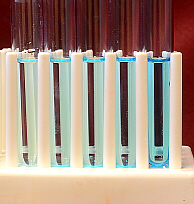
- 5 13 × 100-mm (small) test tubes
and a test tube rack to hold them (note that we have two different sizes of
test tube racks: some with prongs spaced for small test tubes, and others
with prongs spaced for big test tubes make sure you get the right size).
This photo is just to give you a general idea of what youll need, but your
test tubes wont look like this your solutions
will look yellow, not blue.
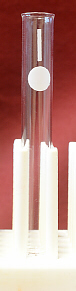
- 2 cuvettes for the
spectrophotometer these must be in a PLASTIC (not metal) rack.
One pair of cuvettes is needed per spectrophotometer, not per student,
and these may already be placed next to each spectrophotometer.
Cuvettes are special optical-quality glass, and thus, several precautions are
needed when handling/using them:
- Because we have several
different brands of cuvettes in use, you will need to make sure that
the two you are using are a matched set (same brand, same color,
etc. look at them from the top to view the glass color)
- Do not touch the lower portion
of the cuvettes only handle them by the top end. This will help
to avoid getting fingerprints on the business end of the cuvette.
- To avoid scratching the
cuvettes (thereby changing the way light passes through them), they
should always be stored only in a plastic rack.
- Also, to further avoid
scratching the cuvettes, you should only use lens paper to
polish the bottom end of a cuvette before placing it into the
spectrophotometer. Make sure you do not use Kimwipes or other
scratchy paper for this purpose.
- When you are done for the day
and are cleaning up, as you rinse out test tubes, make sure that you
keep the cuvettes separate from the test tubes and put them in the
designated rack.
- The lens paper is located in
the drawer at your seat. You will also need a Kimwipe to absorb
droplets of excess liquid, but make sure you can tell the difference between
the two types of paper and use the correct one for the correct function.
- A container of stock riboflavin
solution (0.0002 M = 0.0753 g/L)
- A separate container of unknown
riboflavin solution
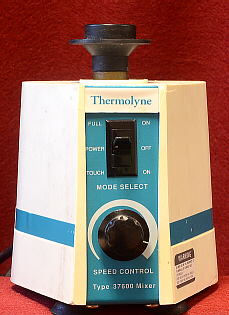
- A vortex This is a machine that will
help to mix the contents of your test tubes.
Carefully examine and draw the pipets and the
spectrophotometer. On your drawing of the spectrophotometer, make sure to
label all the parts and their functions. On your drawing of each pipet,
include
- the total amount that the
pipet can contain, where it says that, and what it says (Do you
have the right size of pipet how do you know its a 1-ml vs. a 5-mL
pipet?)
- the presence of a frosted band around
the top of the pipet If the pipet has such a frosted band, it is a
serological pipet, and if you are emptying the whole pipet, the last drop of
liquid must be blown out to correctly deliver the desired amount.
- an accurate representation of the
actual subdivisions which are marked on the pipet (For example, it would not
be possible to accurately deliver 1.05 mL of liquid with a pipet that was
calibrated in 0.1 mL increments.) How many milliliters does each line
represent?
- Also, as you get ready to use the
pipets, remember to account for whether you are reading the numbers going
up or down. Notice that, if you are using a 1-mL pipet and deliver the
liquid from the 0.0 mL marking down to the 0.7 mL marking, you have delivered
0.7 mL of liquid, but if you deliver the liquid from the 0.7 mL marking to
the bottom you have only delivered 0.3 mL
Pipetting and Mixing Solutions
Mixing Solutions to Test
 Set five 13 × 100 mm test tubes in the test-tube rack.
Make sure the tubes are clean because sometimes they get put away dirty, and
anything in your solution will change the readings you get (Hint: Leave them
clean for the next students, which could be you.).
Be sure that your tubes are labeled so you know which is which.
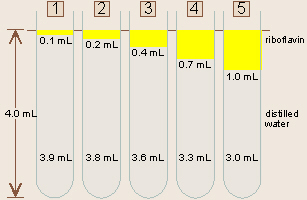
Add the appropriate amount of distilled water (dH2O) and
diluted riboflavin to each tube.
Set five 13 × 100 mm test tubes in the test-tube rack.
Make sure the tubes are clean because sometimes they get put away dirty, and
anything in your solution will change the readings you get (Hint: Leave them
clean for the next students, which could be you.).
Be sure that your tubes are labeled so you know which is which.
Add the appropriate amount of distilled water (dH2O) and
diluted riboflavin to each tube.
| Tube # | mL dH2O | mL Riboflavin | Concentration |
| 1 | 3.9 | 0.1 | 5.0 × 10⁶ M |
| 2 | 3.8 | 0.2 | 1.0 × 10⁵ M |
| 3 | 3.6 | 0.4 | 2.0 × 10⁵ M |
| 4 | 3.3 | 0.7 | 3.5 × 10⁵ M |
| 5 | 3.0 | 1.0 | 5.0 × 10⁵ M |
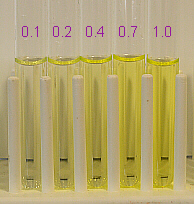 Notice that the total amount of liquid, the total volume, in
each tube should be 4.0 mL. Allowing for some slight variations in manufacture
of individual test tubes, if all of your tubes contain the correct amounts of
water and riboflavin, the final volumes in your filled test tubes should
appear equal on visual inspection. If you look at your tubes, and your
volumes do not all appear to be about the same height, your pipetting
technique was incorrect, and for good results, you should re-mix any tubes
that are off.
Notice that the total amount of liquid, the total volume, in
each tube should be 4.0 mL. Allowing for some slight variations in manufacture
of individual test tubes, if all of your tubes contain the correct amounts of
water and riboflavin, the final volumes in your filled test tubes should
appear equal on visual inspection. If you look at your tubes, and your
volumes do not all appear to be about the same height, your pipetting
technique was incorrect, and for good results, you should re-mix any tubes
that are off.
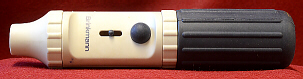
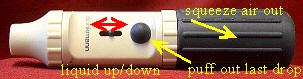 To use one of the pipet fillers, first notice and draw its
parts. There is a small lever that goes up and down, and the liquid in the
pipet will go the same direction: move the lever up and liquid will be sucked
up, move the lever down, and liquid will be released from the pipet. There
is a small spot to push to puff out the last drop of liquid, if needed.
Before pipetting, squeeze the bulb to let some air out (if the bulb is
totally full of air, the pipet filler will not suck liquid up into the
pipet). Fit the desired pipet into the bottom end of the pipet filler, and
immerse the tip of the pipet below the surface of the stock liquid to be
measured. Use the lever to suck up liquid to a level slightly higher than
the amount you need, then adjust downward until the bottom of the meniscus
touches the top of the desired line.
To use one of the pipet fillers, first notice and draw its
parts. There is a small lever that goes up and down, and the liquid in the
pipet will go the same direction: move the lever up and liquid will be sucked
up, move the lever down, and liquid will be released from the pipet. There
is a small spot to push to puff out the last drop of liquid, if needed.
Before pipetting, squeeze the bulb to let some air out (if the bulb is
totally full of air, the pipet filler will not suck liquid up into the
pipet). Fit the desired pipet into the bottom end of the pipet filler, and
immerse the tip of the pipet below the surface of the stock liquid to be
measured. Use the lever to suck up liquid to a level slightly higher than
the amount you need, then adjust downward until the bottom of the meniscus
touches the top of the desired line.
Be very careful to not suck liquids up into the pipet filler.
There is a
filter between the body and the bulb of the filler, and if that gets wet,
it clogs up and becomes disfunctional (not to mention possible contamination
of your solution as well as future pipettings). If solution gets into the
pipet filler, you can assume that both the pipet filler and the solution
within your pipet are contaminated. You will need to give the pipet filler
to the lab staff to be disassembled and cleaned out, your solution will
need to be dumped out, and you will need to start over again.
As you transfer your sample in the pipet from the stock
solution to a test tube, the pipet should be held horizontally to prevent
dripping, but it should be held vertically when delivering the solution into
the test tube. Never hold the pipet upside-down, as the contents could
run into the pipet filler or on to your hand, which if the contents are
supposed to be sterile, would contaminate them (as well as clogging up the
pipet filler).
After you have the correct amounts of liquid in all of your
tubes, then use the vortex to mix them thoroughly. Hold each tube gently
but firmly, by its sides, near the top, and press it down onto the vortex
to mix it. Do not push down on it from the top because your grip isnt as
good that way, and the tube could get away from you, and also because theres
an increased chance of breakage that way.
Solutions should not be mixed by inverting the tube with your thumb on top,
both because chemicals from your thumb could dissolve in the solution and
change your readings, and because some chemicals could damage your thumb.
Use of the Spectrophotometer
Again, the instructions, here, are for the older Spectronic
20s. Please refer to the new instructions for
use of the Spectronic 200s.
After you have mixed all five of your samples, adjust the
spectrophotometer, and read the absorbance at 450 nm (often written as
A450) for each of your samples as follows:
- Set the desired wavelength, 450 nm,
with the upper right-hand knob.
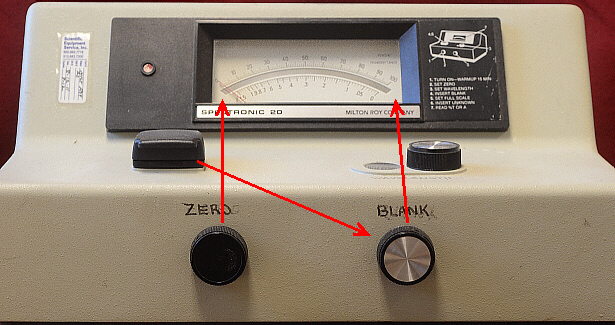
- Without any sample in the
spectrophotometers chamber, adjust the machine to read infinite (∞)
absorbance (= 0% T, but we will not be reading percent transmittance)
at the left end of the scale by rotating the zero-adjust (left-hand) knob.
This tells the machine that, when its totally dark inside, all of the light,
an infinite amount,
is being absorbed, and none of it is left to be detected. As with the pH
meter, if you are looking directly at the needle, you will not be able to
see its reflection in the mirror behind it (remember parallax error?).
- Two cuvettes should be sitting
in a plastic test tube rack next to the spectrophotometer. If they are not
there, obtain two of them, looking at them from the top to make sure they
appear to be the same color (some appear more greenish than others make sure
to get a matched set) and making sure they are clean. Each person
does not need his/her own set of cuvettes, but rather one set per
spectrophotometer is sufficient. Handle the cuvettes only by the top edge
and place only in a plastic rack. Partially fill one of the cuvettes
with dH2O (about 1.5 in or 4 cm in height or about 4 mL is enough,
and the measurement of this does not need to be super-accurate).
 Because
cuvettes are special optical-quality glass, it is imperative to avoid
scratching them, and thus, should be PLACED IN A PLASTIC TEST TUBE RACK
ONLY. Gently polish off fingerprints with lens paper only anything
else (including Kimwipes) would be too rough and might scratch the cuvette,
interfering with your readings just before each time you insert the cuvette
into the machine to take a reading. Again, hold the tube by the top edge
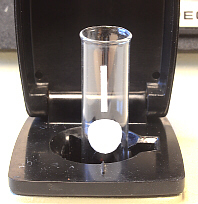
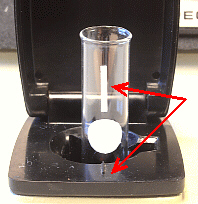
only because fingerprints can change your readings. Insert the cuvette
of plain water into the spectrophotometer with the line on the cuvette lined
up with the raised line on the lip of the specimen chamber on the spectrophotometer.
Gently push the cuvette in as far as it will go (this photo shows the cuvette
sticking out so you can see its line, and its not pushed in all the way) and
close the lid.
Because
cuvettes are special optical-quality glass, it is imperative to avoid
scratching them, and thus, should be PLACED IN A PLASTIC TEST TUBE RACK
ONLY. Gently polish off fingerprints with lens paper only anything
else (including Kimwipes) would be too rough and might scratch the cuvette,
interfering with your readings just before each time you insert the cuvette
into the machine to take a reading. Again, hold the tube by the top edge
only because fingerprints can change your readings. Insert the cuvette
of plain water into the spectrophotometer with the line on the cuvette lined
up with the raised line on the lip of the specimen chamber on the spectrophotometer.
Gently push the cuvette in as far as it will go (this photo shows the cuvette
sticking out so you can see its line, and its not pushed in all the way) and
close the lid.
- Water does absorb certain colors of
light underwater pictures all look blue because many of the other colors
have all been absorbed. Glass also absorbs certain colors of light.
However, in this experiment, the light absorbed by the water and the glass is
irrelevant, and the spectrophotometer needs to be told to ignore the light
they absorb, so we can measure only the light absorbed by the riboflavin.
We can compensate for the light absorbed by the glass and water and read
just what light the sample absorbs by first blanking the machine. Note
that if another solvent than water is used, that solvent must be used to
blank the machine.
Use the lower right knob on the spectrophotometer to adjust the absorbance
to read 0.000 absorbance (= 100% T, right-hand knob for the right-hand end
of the scale). This tells the machine that the glass and water absorb none
of the light and all of the light is being transmitted through the blank
sample.
- Remove the blank from the machine and
place it back into the plastic rack for future use. Put about 4 mL of the
sample from your tube #1 into a second, matched cuvette, polish the
cuvette with lens paper, place the cuvette into the machine with the lines
matching as before, and close the lid.
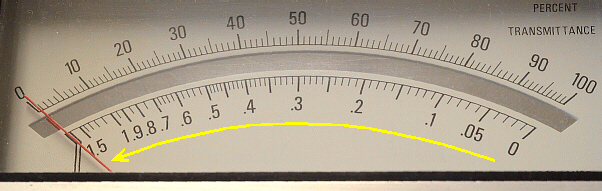
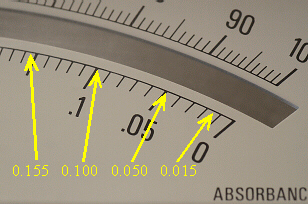
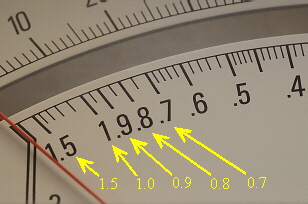
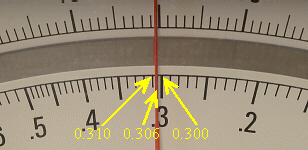 Read the absorbance (bottom scale not top %T scale). Any absorbances
less than 0.7 must be read to three
decimal places remember to interpolate the third place. Any absorbance
readings greater than 0.7 should be read to two decimal places. Note that
the absorbance scale goes RIGHT TO LEFT and is a logarithmic scale
(Thus, the scale intervals get smaller as the scale goes farther
left.). Remember to record your reading in your lab notebook.
Read the absorbance (bottom scale not top %T scale). Any absorbances
less than 0.7 must be read to three
decimal places remember to interpolate the third place. Any absorbance
readings greater than 0.7 should be read to two decimal places. Note that
the absorbance scale goes RIGHT TO LEFT and is a logarithmic scale
(Thus, the scale intervals get smaller as the scale goes farther
left.). Remember to record your reading in your lab notebook. - Return the solution to its test tube.
Gently blot do not rub or wipe the solution from the RIM ONLY of the
cuvette with a Kimwipe, but do not rinse out the cuvette, because when
measuring a number of solutions of increasing concentration, you will dilute
each successive one less if the droplets left in the cuvette are from the
last solution than if they are of water. Do not use paper towel on the
cuvette, do not use Kimwipes except to blot the rim, do not use a test tube
brush or any other scratchy item in or on the cuvettes because scratches
can change the spectrophotometer readings.
- As before, fill the cuvette with the
second solution, polish the cuvette, measure the absorbance, and record your
data in your lab notebook. Optionally, your results may be better if you
double check the machine with the plain water blank in between readings,
although this may not be needed. Repeat these steps to obtain absorbance
readings for the rest of your five solutions, checking the blank in between
as needed.
- Once you have tested your five
solutions, obtain about 4 mL of the unknown solution and place that
in your cuvette (its OK to pour from its container straight into the
cuvette), and determine the A450 of that solution.
- Clean up after yourself. Empty
the cuvettes and rinse thoroughly with dH2O, blot the lip of
each, and replace them upside-down in the designated plastic rack to
drain. Reminder: do not use a brush to clean cuvettes!
Clean all test tubes and place them in the proper, designated
location. When you are cleaning up, do not mix cuvettes and regular test
tubes together, but rather, please keep the cuvettes separate.
Place the used pipets in the designated used pipet receptacle (located near
the sink), not back with the clean ones. If yours is the last lab section
for the day to use the spectrophotometers, they should be turned off and put
away. If another lab is to follow, leave the spectrophotometers on.
Analyzing Your Data
Make sure that as you do the experiment, you take notes on all
procedures, supplemented with illustrations where helpful. Remember to
record all absorbance measurements, correlated with corresponding milliliters
of riboflavin added and molarity of each solution, both in your notebook and
the computer.
Do a rough comparison of the absorbances of your samples as
follows. Since the second dilution contains twice as much riboflavin
as the first one, your absorbance reading for the second dilution should
also be close to 2× that of the first dilution. Similarly, the third should
be 2× that of the second, the fifth 10× that of the first, etc. The accuracy
of your results is an indication of your pipetting technique, so if you did
not pipet carefully enough, and your results are off, you may wish to try
again for any of the solutions for which you got less than satisfactory
results. You are encouraged to repeat your efforts until you get
satisfactory results (Yes, all of the data would go into your
notebook). High-quality results come from careful pipetting, and now is the
time to develop proper technique.
Once you are satisfied with your results, enter the data from
your best results into the
data Web page.
When data are all entered, you may print out a copy of the
class results
for your notebool.
Graph your data. The concentration (the amount of riboflavin)
is the independent variable (X-axis), and the absorbance, which
depends on the concentration, is the dependent variable (Y-axis).
Refer to the
graphing protocol
to construct your graph using proper technique, because proper construction
of a graph of ones data is something every scientist should
know how to do. In this case, if your pipetting technique was good, your
graph should be close to a straight line. In this type of graph, do
not connect from dot to dot, but rather eyeball the best-fit
straight line (use a straightedge to draw it) that best represents your data.
(There is an official, statistical way to calculate the best-fit, straight
line, but for our purposes, well just visually determine where to place
the line.)
Thus, for data points that
dont fall exactly on the line, the line should be placed such that the
distance of points above the line and the distance of points below the line
should be about equal. Also, keep in mind that since we told the
spectrophotometer that plain water absorbed zero (0) light (because it had
zero (0) riboflavin in it), the line on your graph should pass through
the 0,0 point.
In terms of best use of a notebook page for your graph, let every two lines
across the page in your notebook equal 0.1 mL (from 0 to 1.0) of riboflavin
added (= 1 × 10⁵ M), and every line up the page equal 0.020
absorbance units (from 0
to 0.800). Make sure you use equal-sized units on your axes. For example,
if youre using 0.02, 0.04, etc., then 0.12 (NOT 0.20!) follows 0.10.
Label (title) the axes of your graph.
Dr. Fankhausers Dilution Practice Problems
In your lab notebook, do the dilution practice problems
which follow.
Because solutions in science are often much more concentrated
than are desired or can be managed for a given protocol, it is frequently
necessary to dilute these solutions. This requires a working knowledge of
the principles of diluting, dilution factors, concentration factors and the
calculations involved. High dilutions are usually expressed
exponentially.
First, Some Definitions:
- Aliquot:
- a measured sub-volume of sample
- Diluent:
- material with which the sample is diluted
- Dilution factor:
- ratio of final volume (aliquot plus diluent volume) divided by
the aliquot volume
- Concentration factor:
- ratio of aliquot volume divided by the final volume
Example: You make a dilution by adding 0.1 mL specimen
to 9.9 mL of diluent which gives a final volume of 10 mL:
- Dilution Factor = final volume/aliquot volume =
(0.1 + 9.9)/0.1 = 1 to 100, 1:100 or 102
- Concentration Factor = aliquot volume/final volume =
0.1/(0.1 + 9.9) = 0.01 or 102
To prepare a desired volume of solution of a given
dilution:
- Calculate the volume of the
aliquot:
aliquot
volume = concentration factor × final volume
- Calculate the volume of the
diluent:
volume
of diluent = (final volume - sample aliquot volume)
- Measure out the correct volume of
diluent, add the correct volume of aliquot to it, mix.
Sample Problems:
- How much sample is required to
prepare 10 mL of a 1 to 10 dilution, and how much diluent would you need?
- What is the dilution factor when
0.2 mL is added to 3.8 mL diluent? What is the concentration factor?
- What should the aliquot and diluent
volumes be to prepare 5 mL of a 102 dilution?
- You have 0.6 mL of sample, and want
to dilute it to a fiftieth of its present concentration. How much diluent
will you add, and what will the final volume be?
- How would you prepare 20 mL of a
1:400 dilution?
- What is the dilution factor when you
add 2 mL sample to 8 mL diluent?
- You want 1 L of 0.1 M NaCl, and
you have 4 M stock solution. How much of the 4 M solution and how much
dH2O will you measure out for this dilution?
- You add a pint of STP gas treatment
to a 12-gal. fuel tank, and fill it up with gas. What is the dilution
factor?
- You diluted a bacterial culture
106, and plated out 0.2 mL and got 45 colonies on the plate. What
was the concentration of bacteria in the original undiluted culture?
- A hard one: You have 100.0 mL of
dH2O. How much glycerine would you have to add in order to make a
2.00% v/v (volume per volume) solution of the glycerine? (Hint: it requires
a little algebra.)
- Heres another English system one
(for people who arent interested in cars and STP?): if you are making
homemade ice cream, and put 1 tsp of vanilla in a 1-gal. batch of ice cream
mix, what is the dilution factor?
(The answers are on the data-submission Web page.)
Things to Include in Your Notebook
Make sure you have all of the following in your lab notebook:
- all handout pages (in separate protocol book)
- all notes you take during the introductory mini-lecture
- all notes and data you gather as you perform the experiment
- properly-constructed graph of your personal data
- print-out of class data (available online)
- drawing (yours!) of spectrophotometer with detail of the
scale on the meter face, functions of each knob indicated
- drawing (yours!) of cuvette with markings
- drawing (yours!) of 1-mL and 5-mL pipets with detail of all
markings on the pipets and pipet bulb or pipet filler
- drawing (yours!) of vortex with detail of controls
- optionally, color drawing showing what your mixed solutions look
like
- answers to all discussion questions, a summary/conclusion in your
own words, and any suggestions you may have
- any returned, graded pop quiz
Copyright © 2011 by J. Stein Carter. All rights reserved.
Based on printed protocols Copyright © 1979, 1982 D. B. Fankhauser
and © 1989, 1992 J. L. Stein Carter.
Chickadee and bloodroot photographs Copyright © by David B. Fankhauser
This page has been accessed  times since 4 Jul 2011.