Photosynthesis
Plants Do Photosynthesis
Photosynthesis
is the process of converting light energy to chemical energy and storing it
in the bonds of sugar. This process occurs in plants, some algae (Kingdom
Protista), and the cyanobacteria (also known as bluegreen algae, Kingdom
Monera). Photosynthesis requires only light energy, CO2, and
H2O to make sugar. The process of photosynthesis takes place in the
chloroplasts,
specifically using
chlorophyll,
the green pigment involved in photosynthesis.
 Photosynthesis takes place primarily in plants leaves, and little to none
occurs in stems, etc. The parts of a typical leaf include the upper and
lower
epidermis,
the
mesophyll,
the vascular bundle(s) (veins), and the
stomates.
The upper and lower epidermal cells do not have chloroplasts, thus
photosynthesis does not occur there. They serve primarily as protection for
the rest of the leaf.
Photosynthesis takes place primarily in plants leaves, and little to none
occurs in stems, etc. The parts of a typical leaf include the upper and
lower
epidermis,
the
mesophyll,
the vascular bundle(s) (veins), and the
stomates.
The upper and lower epidermal cells do not have chloroplasts, thus
photosynthesis does not occur there. They serve primarily as protection for
the rest of the leaf.
 The stomates are holes which occur primarily in the
lower epidermis and are for air exchange: they let CO2 in and
O2 out. The vascular bundles or veins in a leaf are part of the
plants transportation system, moving water and nutrients around the plant as
needed. The mesophyll cells have chloroplasts and this is where
photosynthesis occurs.
The stomates are holes which occur primarily in the
lower epidermis and are for air exchange: they let CO2 in and
O2 out. The vascular bundles or veins in a leaf are part of the
plants transportation system, moving water and nutrients around the plant as
needed. The mesophyll cells have chloroplasts and this is where
photosynthesis occurs.
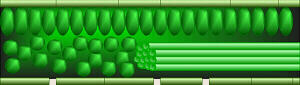
As you hopefully recall, the parts of a chloroplast include the outer and
inner membranes, intermembrane space,
stroma,
and
thylakoids
stacked in
grana.
The chlorophyll is built into the membranes of the thylakoids.
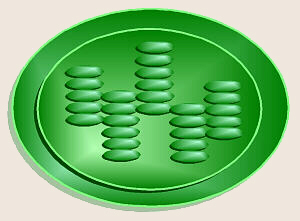
The light reaction happens in the thylakoid membrane
and converts light energy to chemical energy. This chemical reaction must,
therefore, take place in the light. Chlorophyll and several other pigments
such as beta-carotene are organized in clusters in the thylakoid
membrane and are involved in the light reaction. Each of these
differently-colored pigments can absorb a slightly different color of light
and pass its energy to the central chlorphyll molecule to do photosynthesis.
Pigments Involved in Photosynthesis
In this lab you will be examining the pigments present in
plant leaves, separating/isolating these pigments from each other, and
determining absorption spectra for each of them.
Chlorophyll A (chloro = green, phyll = leaf) is
the pigment used by plants to convert energy from the sun into chemical
energy useful to the plant, but other pigments present in leaves also help
to harvest light energy. This energy is stored by converting carbon
dioxide and water to sugar. The chemical reaction for this is
6 CO2 + 12 H2O (+ light energy) → C6H12O6 + 6 O2 + 6 H2O.
 This sugar is stored by the plant as starch (thus the occurrence of
photosynthesis could be demonstrated using the iodine test for starch).
Benedicts solution could be used to test for the presence of sugar (usually
found in the leaf veins, indicating transfer of sugar from one part of the
plant to another).
This sugar is stored by the plant as starch (thus the occurrence of
photosynthesis could be demonstrated using the iodine test for starch).
Benedicts solution could be used to test for the presence of sugar (usually
found in the leaf veins, indicating transfer of sugar from one part of the
plant to another).
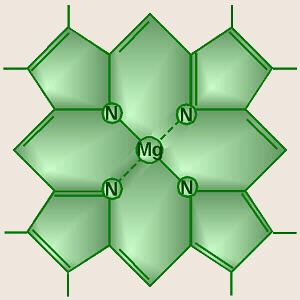
The central part of the chemical structure of a chlorophyll molecule is a
porphyrin ring,
which consists of several fused rings of carbon and nitrogen with a
magnesium ion in the center.
Chlorophyll looks green because it absorbs red and blue light,
making these colors unavailable to be seen by our eyes. It is the green
light which is NOT absorbed that finally reaches our eyes, making chlorophyll
appear green. However, it is the energy from the red and blue light that is
absorbed that is, thereby, able to be used to do photosynthesis. The green
light we can see is not/cannot be absorbed by the plant, and thus cannot be
used to do photosynthesis.
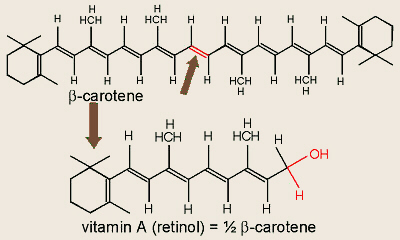
Structure of Vitamin A and β-Carotene
Besides chlorophylls A and B, various other pigments, including
carotenes (carot = carrot), xanthophylls (xantho = yellow), and
anthocyanins (antho = a flower, cyano = blue, dark blue), are
often found in plant leaves. The chemical structures of these molecules are
illustrated in many organic chemistry and cell physiology books. Because of
their different colors, many of the carotenes and xanthophylls are capable of
capturing solar energy that the chlorophyll cannot and transferring that
energy to the chlorophyll enabling photosynthesis to occur. Anthocyanins are
not involved in photosynthesis.
Paper Chromatography
 Once a mixture of these pigments has been extracted from a
leaf together, because each of these pigments, including the chlorophylls,
has a different chemical structure and formula, the mixed pigments can be
separated from each other be a process known as paper chromatography
(chromo = color; graph = to write). In this process, the mixed
pigments are dissolved in a mixture of two (or more) solvents and allowed to
soak into a piece of paper by capillary action. Typically, one of the
solvents used is more covalent while the other is more polar or ionic, and
their molecular weights differ considerably. Various of the leaf pigments,
thus, are more, or less, soluble in the different solvents, so as the
solvent system wets the paper, the various pigments move into/across the
paper at various rates depending on their sizes (molecular weight), relative
number of covalent or ionic bonds in the molecule, and other factors based on
their chemical structures: normally, the smallest move fastest and
farthest.
Once a mixture of these pigments has been extracted from a
leaf together, because each of these pigments, including the chlorophylls,
has a different chemical structure and formula, the mixed pigments can be
separated from each other be a process known as paper chromatography
(chromo = color; graph = to write). In this process, the mixed
pigments are dissolved in a mixture of two (or more) solvents and allowed to
soak into a piece of paper by capillary action. Typically, one of the
solvents used is more covalent while the other is more polar or ionic, and
their molecular weights differ considerably. Various of the leaf pigments,
thus, are more, or less, soluble in the different solvents, so as the
solvent system wets the paper, the various pigments move into/across the
paper at various rates depending on their sizes (molecular weight), relative
number of covalent or ionic bonds in the molecule, and other factors based on
their chemical structures: normally, the smallest move fastest and
farthest.
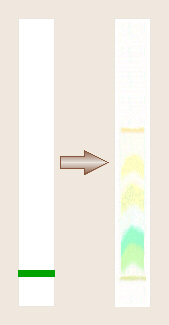
Once the pigments are separated, a tentative identification of
each may be made (to be confirmed by obtaining an absorption spectrum of each.).
Chlorophyll A appears as a blue-green band while chlorophyll B is a
yellow-green band. Carotenes are bright yellow to orange while xanthophylls
are a slightly greenish yellow. Anthocyanins are reddish, violet, or blue,
and are not soluble in organic solvents, thus typically do not move up the
chromatogram at all.
Light Absorbed by Each of the Pigments
The fact that each of these pigments appears as a
different color is an indication that each is absorbing different wavelengths
of light. Remember the color(s) that we see is whatever the plant has NOT
absorbed (For example, chlorophyll A looks green because it is not absorbing
and using green light). According to the literature, chlorophyll A has two
absorption peaks (absorbs the most light) at around 428 nm (blue-violet range)
and at around 660 to 700 nm (red range), while chlorophyll B absorbs best at
around 453 and 643 (to 650) nm. Beta-carotene, the most common carotene (and
precursor of vitamin A), has an absorption peak at a wavelength of 451 nm (at
the blue-violet end of the spectrum). Each of these pigments or the mixture
as extracted from the leaf can be examined with a spectrophotometer to
determine its absorption spectrum, thus confirming its identity.
Effects of Wavelength on Plant Growth
While the present experiment will not test this, it has been
reported that
the blue/violet light absorbed by plants is responsible for foliage growth.
Plants grown in only blue light are compact with lush, dark-green leaves but
few flowers. Red and far-red light affect the growth processes (elongation
and expansion) in various plant parts. Consequently, these colors are
responsible for flower development among other things. Incandescent light is
a good source of light in the red range but lacks output in the blue range
while fluorescent light tends to be better in blue and lacking in the red
end of the spectrum. Vitalightr and similar special fluorescent-type bulbs
are specially-designed for high output in both the blue and red ranges, yet
are low in the green range (hence tend to look purplish or pinkish in color).
Many plant growers combine incandescent and fluorescent lights.
Safety Considerations
The chemicals in the solvent system being used in Part A and
the ethanol used in Part B are flammable, thus should be kept away from any
open flames. Pouring of solvent system to/from the Erlenmeyer flask should
take place in a fume hood, and the reagent bottle and your flask should
immediately be capped. It probably is also a good idea to not breathe too
much of it.
Materials Needed
Part A Paper Chromatography
- Fresh spinach (or other leaves of ones choice optionally,
if available, leaves may be picked from outdoors. Brightly-colored
autumn leaves could be interesting to test.)
- Freshly-made solution of 90% petroleum ether + 10% acetone
- Whatman #1 chromatography paper (continuous strip)
- Penny (or other coin)
- 250-mL Erlenmeyer flask with rubber stopper (#8) to fit it,
T-pin
- Forceps and scissors
- 95 or 100% EtOH
- 13×100 (small) test tubes and rack
- Parafilm®
- Hand-held UV light
Part B Spectra of Pigments
- Tubes of pigments from Part B
- 95 or 100% EtOH
- Fresh or dried leaves of spinach, parsley, or kale
- Mortar and pestle
- Funnel and circular filter paper
- (Optional red, yellow, blue, and green food color, methylene
blue, riboflavin, and/or other pigment solutions of interest)
- Additional 13×100 test tubes
- Spectrophotometer, cuvettes in plastic rack, lens
paper
Procedure
Part A Paper Chromatography
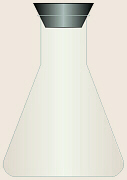
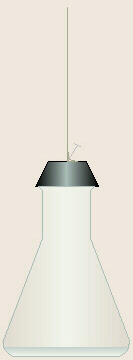
- A 250-mL Erlenmeyer flask, #8 stopper,
and T-pin should be obtained. Working in the fume hood, a few millimeters
(depth) of the 90% petroleum ether + 10% acetone solution should be poured
into the bottom of the flask and the stopper placed on the flask so that the
fumes can start to accumulate in the flask while the next few steps are
performed. The air in the flask must become saturated with fumes from the
solvent or the chromatography wont run properly.
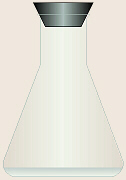
- A piece of chromatography paper
slightly longer than what will fit into the flask should be obtained. It is
important to touch it as little as possible, preferably only at the edges.
The bottom edge of the paper should be cut as straight as possible. The
paper should be long enough that when a T-pin is used to attach it to the
underside of the stopper, the tip of the paper will reach to within a few
millimeters of the bottom of the Erlenmeyer flask.
 This paper must be kept
as clean as possible, handled only by the edges, and only set on clean
surfaces.
If it is necessary to mark on the chromatography paper, only
pencil should be used, not pen (ballpoint ink is alcohol-soluble).
This paper must be kept
as clean as possible, handled only by the edges, and only set on clean
surfaces.
If it is necessary to mark on the chromatography paper, only
pencil should be used, not pen (ballpoint ink is alcohol-soluble).
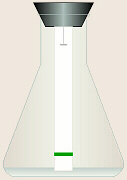
- A spinach (or other) leaf should be
obtained. The chromatography paper should be laid on a piece of clean paper
and the leaf laid over the chromatography paper. The edge of a penny (or
other coin) may be used to roll (smash) a stripe of color across the paper
about 1.5 to 2 cm above the end. The leaf should be moved so a new portion
of the leaf is over the stripe, and re-rolled with the penny over/onto
the same place on the paper to darken the stripe. This process should
be repeated several times as needed to obtain a dark stripe. The stripe
should be allowed to dry before proceeding.
- The chromatography paper should be
held up next to the flask to judge the exact length of paper needed such that
when the paper is pinned to the bottom side of the stopper, the bottom end of
the paper will be just below the surface of the solution. If needed, the top
end of the strip should be folded over at the right place.
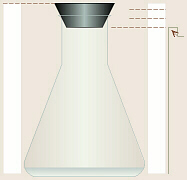
- The flask should not be left
open while pinning the paper to the stopper. With the flask placed in its
permanent location, the stopper should be quickly flipped upside-down on
top of the flask so the flask remains sealed.
 The flask should be kept open
the minimum amount of time possible. The T-pin should be used to attach the
top (non-pigment end) of the paper to the center bottom of the rubber stopper.
When the paper is securely attached, the stopper should quickly be flipped
right-side-up and inserted into the flask in such a way that the paper does
not touch the sides. The bottom of the paper should be barely in the solvent
so that the solvent will be soaked up. It is imperative that you not move,
jostle, or slosh the flask once the paper is soaking!
The flask should be kept open
the minimum amount of time possible. The T-pin should be used to attach the
top (non-pigment end) of the paper to the center bottom of the rubber stopper.
When the paper is securely attached, the stopper should quickly be flipped
right-side-up and inserted into the flask in such a way that the paper does
not touch the sides. The bottom of the paper should be barely in the solvent
so that the solvent will be soaked up. It is imperative that you not move,
jostle, or slosh the flask once the paper is soaking!

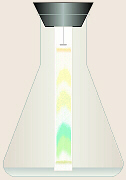
- As the solution is absorbed into the
paper by capillary action, it will carry the various pigments up from the
center. When the farthest band is about 1.0 to 0.5 cm away from the top of
the paper or close to touching the T-pin, the chromatography may be stopped
by removing the paper from the flask and replacing the stopper. The
chromatogram should be observed and drawn, especially noting the colors of
the various bands that are visible. The paper should be handled carefully,
and no marks should be made on it.
- As a class, the identical bands will
be put together and the pigments re-dissolved. One labeled 10 × 130 test
tube will be supplied for each band Using (CLEAN) scissors, the
various bands should be cut apart from each other (remember which is which).
Each should then be placed as far into the bottom of the designated 10 × 130
test tube as possible. Everyones identical bands (i. e. all outer
yellow bands) should go into the same tube to make the solutions as
concentrated as possible. After everyones bands have been collected, the
instructor (or an appointed class member) should place about 5 mL of 100%
ethanol into each tube. Each tube should be labeled (if not done previously)
and covered with Parafilm®. Each label should include the order and
color of the band that tube contains (for example, outer yellow). The
covered tubes should be placed in the designated rack for storage until the
next lab period.
- All tubes being saved must be
properly labeled and covered, then placed into a rack and stored in an
appropriate location until next period. Chromatography solvent should
be returned to the reagent bottle for reuse. All glassware should be washed
and placed in the racks to dry. All scraps of chromatography paper and
spinach should be disposed of properly and any other general clean-up should
be done.
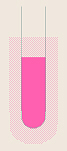
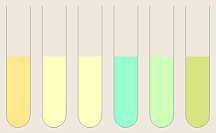
- Once the pigments have been
re-dissolved in ethanol, your instructor may use the UV light to examine the
tubes to demonstrate how chlorophyll (and any of the other pigments?)
fluoresces.
Part B Spectra of Pigments
- For this part of the experiment,
students will be working in groups, based on the number of spectrophotometers
available and the number of students in the lab section. (Optionally, as a
class, a drop of each color of food coloring may be diluted with 100% EtOH
so these may also be tested.) Someone in the class may grind a piece of
spinach leaf or some dried parsley with a mortar and pestle, then add 100%
EtOH to extract the plant pigments. Then, a small test tube, rack, glass
funnel, and a piece of circular filter paper should be obtained. The test
tube should be placed into the rack and the funnel into the test tube. The
paper should be folded in half, then in quarters (half of half) as
demonstrated by the instructor, then inserted into the funnel. The
newly-extracted pigment solution should be poured through the filter paper to
remove any particles. If this solution is very dark green, it will need to
be diluted with more ethanol (see below).
- The tubes containing the isolated
bands from the chromatograms (and those containing the diluted food coloring)
will be distributed among the groups of students so that each group should
have at least one of the redissolved, isolated bands and something else
(mixed spinach or parsley pigments and/or food coloring and/or methylene
blue or riboflavin) to test.
- One (CLEAN without
methylene blue stains) cuvette should be obtained for each solution the
group will be testing plus one for plain EtOH, making sure to match glass
colors (types/brands of cuvettes).
Each cuvette should first be tested for the presence of unwanted, left-over
methylene blue by placing a small amount of 100% EtOH in it, swirling, and
holding the tube against a white surface. If a cuvette needs to be cleaned,
do not use water to rinse it because all the solutions we will be testing are
dissolved in EtOH, and water could interfere with the readings. For this
experiment, only EtOH should be used to clean out cuvettes.
Because it is so difficult to remove markings from cuvettes, and considering
the possibility that any marks on them may interfering with the readings that
will be taken, it is better to just line them up in the test tube rack in a
pre-determined order corresponding to the labeled test tubes from the
pigments being tested.
In the unlikely case that it is necessary to label the cuvettes, ONLY
PENCIL SHOULD BE USED, lightly writing only on the white area provided.
DO NOT USE WAX MARKER OR LAB PEN!
The cuvette that will serve as the blank should have about 4 or 5 mL of 100%
ethanol added to it. Later, each pigment solution to be tested will be
poured directly from its test tube into its own cuvette.
- While the redissolved, individual
bands are probably dilute enough, if you are testing a solution of
freshly-extracted, mixed parsley or spinach pigments, that may be too
concentrated and may need to be diluted so the readings for it are not off
the scale. Remember, Beers Law says that, by diluting a sample, its
absorbance (at all wavelengths) will decrease.
The chlorophylls in the mixture cause it to have an absorbance peak (highest
amount of light absorbed) near 425 nm, so we want to adjust the concentration
of the solution so that the A425 is not over 1.00. To do that,
first, the wavelength on the spectrophotometer should be set to 425 nm. The
zero and blank (using EtOH so that the machine subtracts out readings for
whatever light the solvent absorbs) should be adjusted. Then, the absorbance
of the mixed pigment solution should be read, and if the A425 is greater than
about 1.000, it is necessary to dilute the sample. Ethanol should be added
to dilute the solution and decrease the A425 to no more than 1.000. While
it is possible to just play around with adding more ethanol or pigment
solution until the absorbance is acceptable, if great accuracy is desired,
the amount of alcohol needed can be calculated as follows.
Recall that Beers Law says that, for example, if the absorbance reading is
2.00, theoretically, the addition of an equal volume of EtOH should dilute the
sample to half its original concentration, such that the absorbance is half
of the original, or only 1.00. Assuming youre starting with 4 mL of pigment
solution, the amount that you might typically use in a cuvette, Beers Law
would mean that,
| A425 = 2.00 | = | A425 = 1.00 |
| (x amt)/ ~4 mL soln | (x amt)/ ~4 mL soln + ~4 mL EtOH |
where (x amt)/# of mL is an expression of concentration. The units used to
express x could be moles, grams, or whatever, and since its the same on
both sides, it cancels out and is not even necessary to know. This equation
can be rewritten in general terms as,
| Ai (A425 observed) | = | Af (A425 desired of 1.00) |
| (x amt)/ Vi (initial mL of soln) | (x amt)/ Vf (initial mL of soln + mL of EtOH needed) |
which can be simplified to,
| Ai (A425 observed) × Vi (init mL of soln) = |
| Af (A425 desired of 1.00) × Vf (initial mL of soln + mL of EtOH needed) |
and may be used to determine the amount of EtOH needed. When solved for
milliliters of ethanol needed, this equation becomes:
| mL of EtOH needed = | Vi (initial mL of soln) × [Ai (A425 observed) Af (A425 desired of 1.00)] |
| Af (A425 desired of 1.00) |
If the desired, final absorbance reading is 1.00, this can be simplified to,
| mL of EtOH needed = Vi (initial mL of soln) × [Ai (A425 observed) 1.00] |
Whether the amount of EtOH needed is calculated as just explained or whether
a guesstimate amount is used, approximately the needed amount of alcohol
should be added and a new A425 reading obtained. As needed, the
volume should be adjusted further and another reading taken. When the
A425 is 1.000 or slightly less, the concentration has been
properly adjusted. About 4 to 5 mL of the diluted solution should be kept
in (or placed in) a cuvette for testing.
- The isolated pigment bands are dilute
enough that they are OK as is and do not need to be diluted. Each should be
decanted into a separate, clean (check first for methylene blue) cuvette,
taking care to not include any of the paper pieces.
- Absorbance readings should be
obtained for all pigments at 25-nm intervals, and the process of obtaining
readings will be quicker if all samples for which the group is responsible
are tested at a given wavelength before changing to the next wavelength
(all tested at 350 nm, then all at 375 nm, etc.). It is much more
time-consuming to test one sample at all wavelengths, then go back and start
over to test a second sample, etc. Initially, the wavelength should be set
to 350 nm and the zero and blank rechecked. Absorbance readings should be
obtained for all specimens the group is testing.
 Then the spectrophotometer
should be set at 375 nm, the zero and blank readjusted, and another set of
readings obtained. Readings of absorbance should be taken at 25-nm intervals
from 350 to 800 nm (350, 375, 400, etc.). Each time the wavelength is
changed, it is necessary to recheck both the zero and the blank to get
correct readings. Readings should be obtained for each of the bands being
tested before changing wavelength. Readings should be recorded in students
lab notebooks in chart form with columns for wavelength and for each of the
samples. Also, data should be entered online.
Then the spectrophotometer
should be set at 375 nm, the zero and blank readjusted, and another set of
readings obtained. Readings of absorbance should be taken at 25-nm intervals
from 350 to 800 nm (350, 375, 400, etc.). Each time the wavelength is
changed, it is necessary to recheck both the zero and the blank to get
correct readings. Readings should be obtained for each of the bands being
tested before changing wavelength. Readings should be recorded in students
lab notebooks in chart form with columns for wavelength and for each of the
samples. Also, data should be entered online.
Data
Part A Paper Chromatography
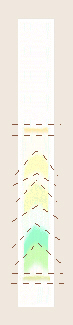
The resulting bands on the chromatography paper should be
drawn (then colored with colored pencils?) and described (color, location
with respect to the solvent front and/or original spot). A tentative
identification should be assigned to each of the pigments based on the list
of pigment colors mentioned in the Background. From the colors of the
individual bands on the chromatogram, which pigment does each of these bands
appear to represent? Which is the smallest or fastest-moving molecule?
Which is the slowest?
Remember to draw any new equipment used.
Part B Spectra of Pigments
- All spectrophotometer readings should
be recorded in group members lab notebooks. A suggested format is:
| Wavelength | Pigment #1 (Name?) | Pigment #2 (Name?) |
| 350 mn | absorbance? | absorbance? |
| 375 mn | absorbance? | absorbance? |
| etc. |
- Data for the absorption spectra of
all solutions/bands tested should also be
entered online
(once per group per set of data, not multiple entries of the same data).
When all data have been entered, you may then return to the Web site to
print out the
class data.
- For each sample the group tested, a
graph of wavelength (on the X- or horizontal axis) versus absorbance (on the
Y- or vertical axis) should be constructed. The graphing protocol should be
used as a reference on proper graphing techniques. Because this
graph represents data which do not exhibit a proportional correlation,
sequential points should be connected in dot-to-dot fashion, and the graph
will not be a straight line graph. Absorption maxima (peaks)
and minima for each of the solutions tested should be noted.
The example, above, is a graph of the spectra for two concentrations of
Chlorophyll A, represented by the black line and the greenish line, and the
spectrum for Carotene, represented by the pinkish line. Because the
concentrations of the solutions were not standardized in any way,
the heights of the peaks (which, you should recall, are merely
concentration-dependent) are not significant (differences in concentrations
of solutions are not being examined in this experiment), but rather, as
notated in the example, above, the locations of the peaks, the maxima,
as well as the minima, relative to the wavelengths tested, are important data.
Thus it is important that Chlorophyll As maximum is at 425 nm as
compared to Carotenes maximum at 450 nm, and it is important that
Chlorophyll As minimum is at 525 nm as compared to Carotenes minimum at
600 nm. For this experiment, we dont care that at 425 nm, the absorbance for
one of the Chlorophyll A solutions was 0.59 and the other was 0.29 all that
means is that one solution was about twice as concentrated than the other,
but the important thing is that Chlorophyll A had a maximum absorbance peak
at 425 nm. It is also important that Chlorophyll A has a second maximum
at 675 nm.
Also, because these glass cuvettes are only good in the visible
range (UV takes special quartz cuvettes and IR takes special salt cuvettes),
the drift at the beginnings and ends of the graph, where the wavelength is
approaching the ultraviolet or infrared range are meaningless for this
experiment.
- At what wavelength(s) did each of the
isolated pigments absorb the most/least light? Do the observed absorption
maxima and minima correspond to those reported in the literature for each of
those pigments? Were the tentative identifications of the bands correct do
the absorption data support the identifications made based on
color/appearance? To what colors do these wavelengths correspond?
- The absorption spectrum of the mixed
pigments tested should be compared with the spectra from the various known
pigments. By matching the peaks, which of the individual pigments does the
mixed pigment solution contain? Also, at which wavelengths did the mixed
plant pigments absorb the most light where were the absorbance peaks? To
what colors do these wavelengths correspond? At which wavelength did they
absorb the least light where was the absorbance closest to zero? To what
color does this correspond?
- If methylene blue, food coloring,
or any other pigments were also tested, the same analysis should be done for
each pigment tested. The absorption maxima and minima should be determined
for each of the colors tested. What wavelength(s) of light is/are each of
the colors absorbing (therefore unavailable to a plant), and what
wavelength(s) is/are each color not absorbing (therefore reflecting or
transmitting and available to a plant). If a plant was placed into a
solution containing this/these pigment(s), what wavelength(s)/color(s) of
light would be available to the plant to use?
- Any other significant notes,
observations, and data should be included.
Optional Additional Experiment(s)
- The anthocyanins in leaves such as those of red cabbage are soluble in
water, and may be extracted by putting red cabbage in a blender with water,
then straining off the pulp. Adding acid changes the color of the cabbage
juice to a bright, cherry red, adding a base turns it a dark, forest green,
and adding tap water sometimes changes it to blue. Anthocyanins are also
soluble in methanol and ethanol, and so may be extracted using one of those,
but at least with ethanol, within a few hours the solution fades to clear.
Once spotted onto chromatography paper (either from a methanol or ethanol
extract or using a penny to apply pigment directly), it appears that the
anthocyanins will not move using the solvent systems typically used for
chromatography of plant pigments. Optionally, a spectrum could be obtained
for freshly-extracted pigment from red cabbage leaves. A comparison of
spectra for red cabbage juice in acidic and basic solutions would also be
interesting. Experimentation with various chromatography solvents could be
done to try to find a system that would allow anthocyanins to move.
- Blue-green algae (bacteria-relatives in Kingdom Monera) like
Spirulena also contain a bluish pigment, phycocyanin, which is
water-soluble and is not used in photosynthesis. Because Spirulena
is a microscopic organism, using a penny to roll pigments onto
chromatography paper wouldnt work. The pigments in Spirulena would
have to be extracted in some solvent (like was done for the spinach/dried
parsley in Part B), then spotted onto chromatography paper if so desired.
Phycocyanin appears to be insoluble in EtOH (or only slightly). Optionally,
a spectrum of water-extracted Spirulena could be taken (use water as
the blank) and/or experimentation undertaken to try to find a chromatography
solvent with which phycocyanin could be separated from the various
photosynthetic pigments also present in Spirulena.
- It might be interesting to try to extract pigments from carrots or other
vegetables high in β-carotene, then performing paper chromatography on
the extract and obtaining absorption spectra for the pigments thus
isolated.
- Health-food stores often sell chlorophyll extract. It might be
interesting to obtain some of that to use for chromatography and spectral
analysis.
Things to Include in Your Notebook
Make sure you have all of the following in your lab notebook:
- all handout pages (in separate protocol book)
- all notes you take during the introductory mini-lecture
- drawing (yours!) of chromatography set-up
- optional sample of chromatography paper &/or Parafilm backing
&/or the leaf you used
- notes on chromatography results
- labeled (which band was which and where were they?) drawing
(yours!) of finished chromatogram
- your in-class spectrophotometer data
- your properly-constructed graph of your groups spectrophotometer
absorbance data
- any other notes and data you gather as you perform the experiment
- print-out of class data (available online)
- answers to all discussion questions, a summary/conclusion in your
own words, and any suggestions you may have
- any returned, graded pop quiz
Copyright © 2011 by J. Stein Carter. All rights reserved.
Based on printed protocol Copyright © 1986 D. B. Fankhauser
and © 1989 J. L. Stein Carter.
Chickadee photograph Copyright © by David B. Fankhauser
This page has been accessed  times since 5 Sep 2011.